> ## Documentation Index
> Fetch the complete documentation index at: https://docs.xano.com/llms.txt
> Use this file to discover all available pages before exploring further.
# Error Logs
## Monitoring Errors Across your Workspace
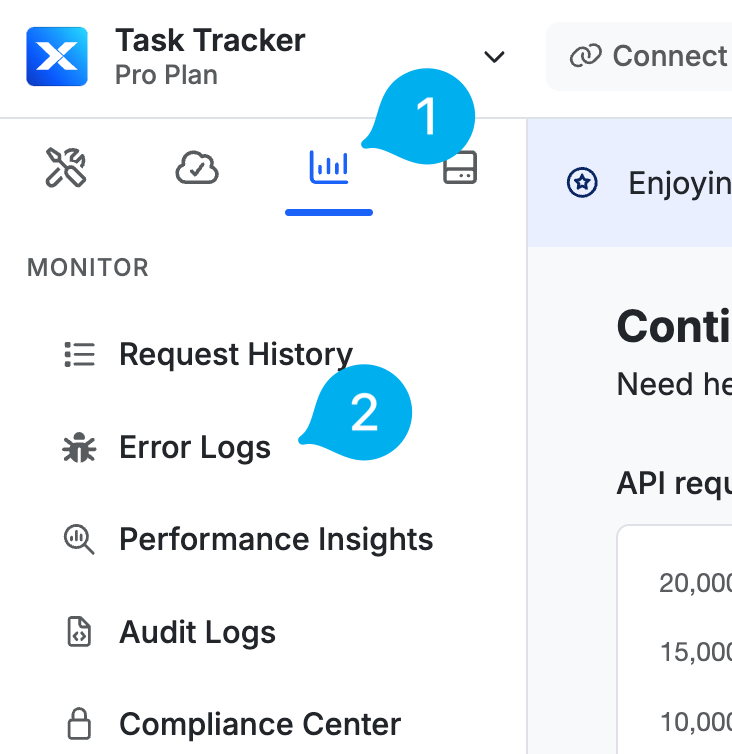
Access the Error Logs dashboard from the left-hand navigation.
 The dashboard provides a detailed overview of any errors that have occurred across your workspace over the last 24 hours.
### Header
At the top of the dashboard, you'll see a row of interactive cards detailing specific areas of errors present.
The dashboard provides a detailed overview of any errors that have occurred across your workspace over the last 24 hours.
### Header
At the top of the dashboard, you'll see a row of interactive cards detailing specific areas of errors present.
 ## Card Types
### All Errors
Displays all logged errors across your workspace. You can click individual time segments to drill into specific periods.
Each other card listed below displays:
* the total number of errors
## Card Types
### All Errors
Displays all logged errors across your workspace. You can click individual time segments to drill into specific periods.
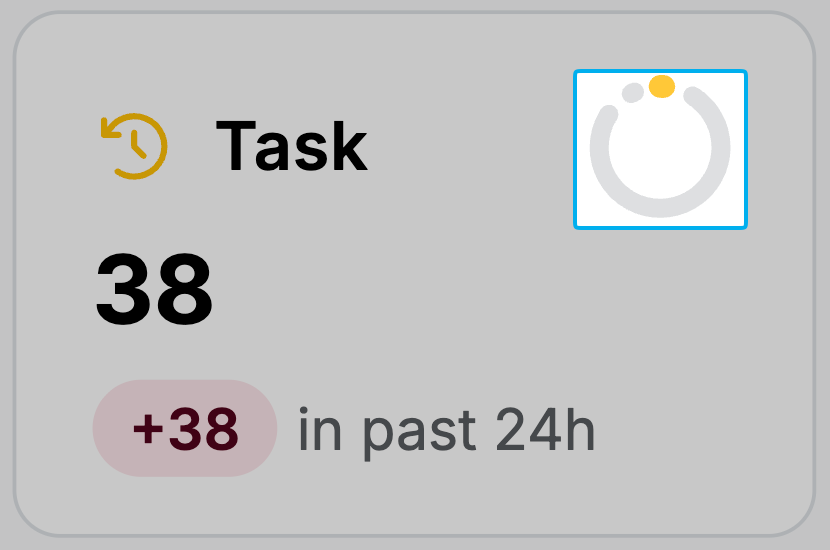
Each other card listed below displays:
* the total number of errors 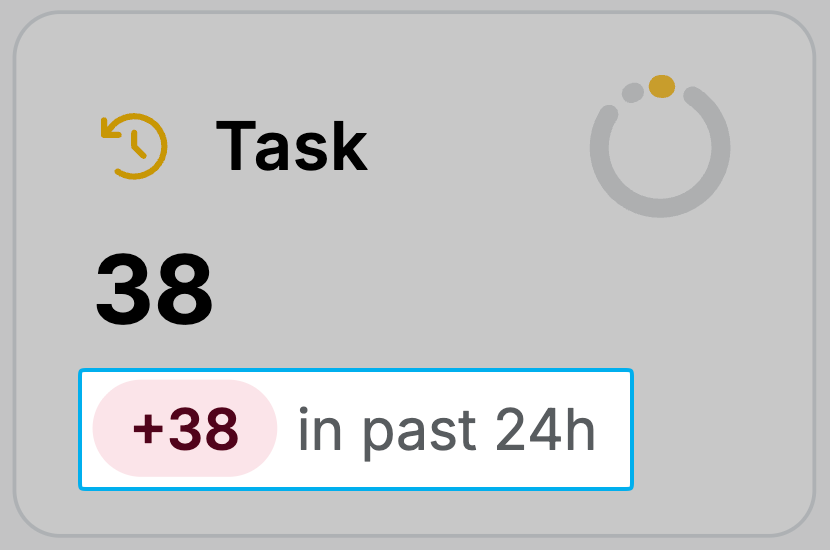 * an error ratio ring comparing errors to successful runs
  * when selected, a **clear** option to return to the default view
 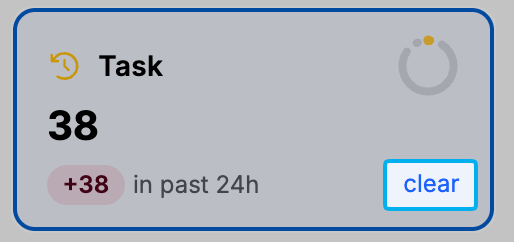 ### Task
Displays errors occurring in background tasks.
### API
Displays errors occurring in your APIs.
### Function
Displays errors occurring in your custom functions.
### Middleware
Displays errors occurring in middleware execution.
### Trigger
Displays errors occurring in triggers.
## Error Table
Below the header is a table displaying more detailed information about each error logged across the workspace. You can filter the columns to drill down to specific statements, stacks, or time periods. Use the search box to quickly locate specific errors or workflows.
| Column | Description |
| ---------- | ------------------------------------------------------------------------------------------------------------------------------------------------------------ |
| Past 24h | An interactive graph depicting the number of occurrences in the last 24 hours, or in the selected time period |
| Error | The standardized error code, and any custom message attached |
| Stack | Where the error occurred -- the same error across multiple workflows will each have their own row in the table, nothing is combined |
| Last Seen | When the error occurred most recently |
| First Seen | When the error first occurred |
| Urgency | A measure based on the ratio of errors to successful runs -- note that this does not indicate the true severity of the issue and is strictly based on volume |
## Accessing Error Logs for a Specific Workflow
Error Logs are available in the settings menu of most workflow types and provide quick access to:
* Review of any errors that occurred via external calls within the chosen timeframe (24 hours, 7 days, 30 days, or all available)
* How many times the error occurred
* The statement that triggered the error(s)
* The ability to ignore future occurrences of the error, or mark it as fixed
Click on the icon in the top right corner and choose
### Task
Displays errors occurring in background tasks.
### API
Displays errors occurring in your APIs.
### Function
Displays errors occurring in your custom functions.
### Middleware
Displays errors occurring in middleware execution.
### Trigger
Displays errors occurring in triggers.
## Error Table
Below the header is a table displaying more detailed information about each error logged across the workspace. You can filter the columns to drill down to specific statements, stacks, or time periods. Use the search box to quickly locate specific errors or workflows.
| Column | Description |
| ---------- | ------------------------------------------------------------------------------------------------------------------------------------------------------------ |
| Past 24h | An interactive graph depicting the number of occurrences in the last 24 hours, or in the selected time period |
| Error | The standardized error code, and any custom message attached |
| Stack | Where the error occurred -- the same error across multiple workflows will each have their own row in the table, nothing is combined |
| Last Seen | When the error occurred most recently |
| First Seen | When the error first occurred |
| Urgency | A measure based on the ratio of errors to successful runs -- note that this does not indicate the true severity of the issue and is strictly based on volume |
## Accessing Error Logs for a Specific Workflow
Error Logs are available in the settings menu of most workflow types and provide quick access to:
* Review of any errors that occurred via external calls within the chosen timeframe (24 hours, 7 days, 30 days, or all available)
* How many times the error occurred
* The statement that triggered the error(s)
* The ability to ignore future occurrences of the error, or mark it as fixed
Click on the icon in the top right corner and choose
 Use the options at the top to filter by time range or refresh if you're waiting for a specific error to appear, then select the error you'd like to explore further from the list below.
 **Error code**
The standardized error message that identifies the error type.
**Error message**
Some errors, such as those triggered by preconditions, can have custom messages attached, which will appear here.
**Statement**
The statement that triggered the error.
**Occurrences**
The number of times the error occurred.
**First seen**
How long ago the first occurrence happened.
**Last seen**
How long since the most recent error of this type was logged.
**Error graph**
Shows a graph view of the errors per hour.
The error log also provides several actions you can take to manage errors:
**Ignore this error**
Marks the error as ignored, which will cause it to be hidden by default and not appear in the New error count.
**Mark as fixed**
Marks the error as fixed. Any reappearances of this error will be flagged as a regression.
**Captured Errors**
Provides quick access to specific requests from the request history that showcase the error. You can review variable state, inputs, and outputs from here.
Click the next to the Request Input to quickly copy the data sent and run it again using the debugger for further troubleshooting.
**Error code**
The standardized error message that identifies the error type.
**Error message**
Some errors, such as those triggered by preconditions, can have custom messages attached, which will appear here.
**Statement**
The statement that triggered the error.
**Occurrences**
The number of times the error occurred.
**First seen**
How long ago the first occurrence happened.
**Last seen**
How long since the most recent error of this type was logged.
**Error graph**
Shows a graph view of the errors per hour.
The error log also provides several actions you can take to manage errors:
**Ignore this error**
Marks the error as ignored, which will cause it to be hidden by default and not appear in the New error count.
**Mark as fixed**
Marks the error as fixed. Any reappearances of this error will be flagged as a regression.
**Captured Errors**
Provides quick access to specific requests from the request history that showcase the error. You can review variable state, inputs, and outputs from here.
Click the next to the Request Input to quickly copy the data sent and run it again using the debugger for further troubleshooting.
 ## What's next
Now that you're familiar with error logs, head to the Dashboard and review other errors that may be present in your request history. You may also find it helpful to use the [Statement Explorer](/maintenance-monitoring-and-logging/statement-explorer) to review other statements of the same type, even if they aren't experiencing errors currently, to proactively prevent similar issues from occurring.
## What's next
Now that you're familiar with error logs, head to the Dashboard and review other errors that may be present in your request history. You may also find it helpful to use the [Statement Explorer](/maintenance-monitoring-and-logging/statement-explorer) to review other statements of the same type, even if they aren't experiencing errors currently, to proactively prevent similar issues from occurring.