> ## Documentation Index
> Fetch the complete documentation index at: https://docs.xano.com/llms.txt
> Use this file to discover all available pages before exploring further.
# Things Feel Slow
If you find that something feels slow, whether that's a specific function or an entire workflow, follow these steps to troubleshoot and resolve the issue.
## Quick Checks
Before diving into more detailed troubleshooting, perform these quick checks:
* Can you access your instance from the [instance selection screen](https://app.xano.com/instance?mode=master)?
* Are your APIs responding, even if slowly?
* Are you able to access the Xano UI without significant delays?
* Does the [Xano Status Page](https://status.xano.com) show any ongoing incidents or maintenance?
If you answered "no" to any of the above questions, please refer to the appropriate troubleshooting guide:
* If you cannot access your instance, see [What to Do If Your Instance Is Down](/troubleshooting-and-support/my-instance-is-down).
* If your APIs are not responding, see [What to Do If Your APIs Aren't Responding](/troubleshooting-and-support/my-apis-arent-responding).
## Identify what is slower than expected
In the sidebar, switch to the Monitor tab, and select Performance Insights.
### What can I see with Performance Insights?
Performance Insights enable you to analyze performance of specific function stacks or function types across your entire workspace. You'll be able to easily answer questions like:
* How long does a specific Lambda function take to run, on average, over the last 24 hours?
* What are my top 5 most resource intensive database queries?
* What API takes the longest to run consistently?
### How do I use Performance Insights?
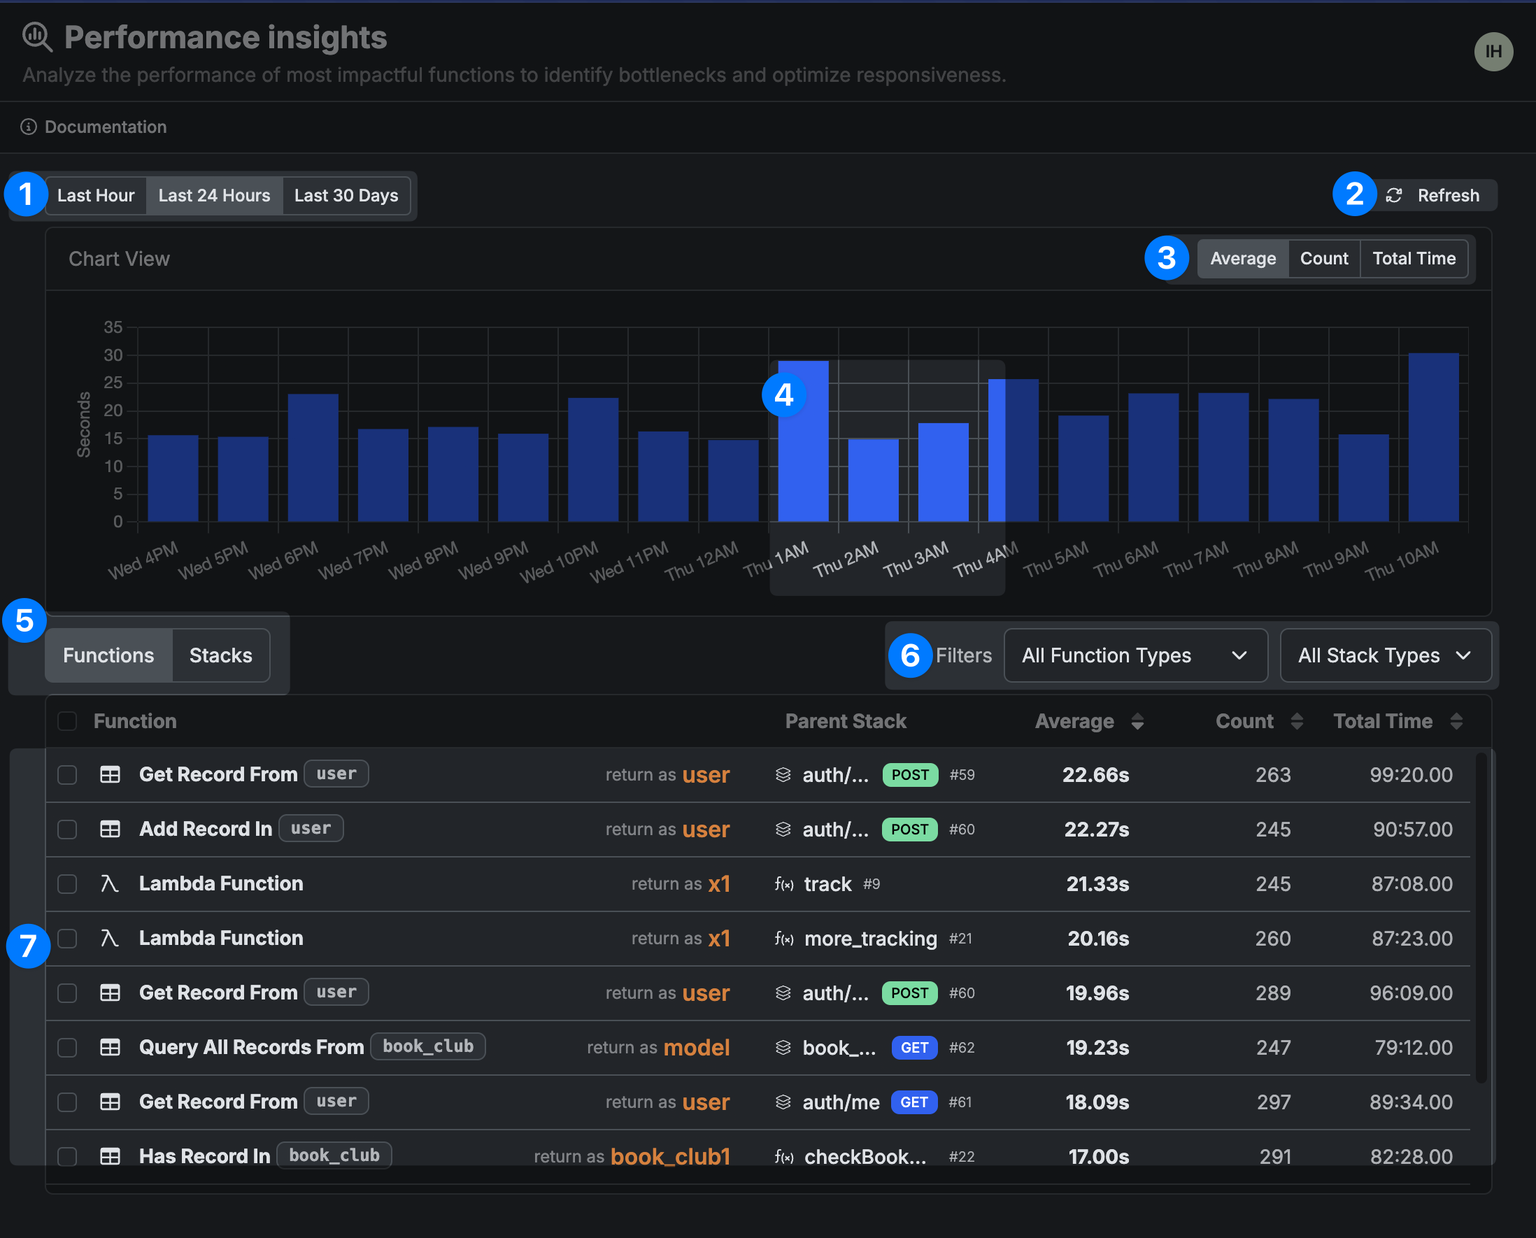
Use the image below and the table to learn more about each section of the Performance Insights screen.
| Key | What is it? | What's it for? |
| ----- | -------------------------------------------------------------------------------------------------------------------------------------------------------------------------------------------------------------------------------------------------------------------------------------------------------------------------------------------------------------------------------------------------------------------------------------------------------------------------------------------------------------------------------------------------------------------------------------------------------------------------------------------------------------------------------------------------------------------------------------------------------------------------------------------------------------------------------------------------------------------------------------------------------------------------------------------------------------------------------------------------------------------------------------------------------------------------------------------------------------------------------------------------------------------------------------------------------------------------------------------------------------------------------------------------------------------------------------------------------------------------------------------------------------------------------------------------------------------------------------------------------------------------------------------------------------------------------------------------------------- | ------------------------------------------------------------------------------------------------------------------------------------------------------------------------------------------------------------------------------------------------------------------------------------------------------------------------------------- |
| **1** | | Choose a period of time to view data from |
| **2** | | Refresh available data |
| **3** | | Choose the type of statistics returned — Average: the average execution time of that function or function stack in the selected period of time; Count: the number of times the function or function stack was executed; Total Time: the total time of all executions of the function or function stack in the selected period of time |
| **4** | | Hover over any part of the chart to see specific statistics about that time period. |
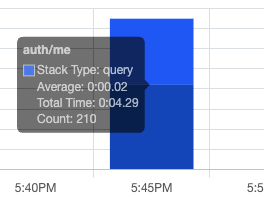
| | | In some views, you'll be able to split the bar in the graph by function or function stack. |
| **5** | | Filter the graph and list of data to show either individual function calls, or function stacks. |
| **6** | | Filter the data by function types, or function stack types. |
| **7** | | In the list, you can click on the individual function or function stack to jump right to where it is in your workspace. |
Once you've identified specific functions or workflows to address, you can take steps to optimize them. Consider the following optimization techniques:
1. **Get a dedicated instance in a region that's closest to your customers** The Free plan shares resources with other users. When you upgrade, each paid Xano instance is on dedicated resources and allows you to deploy in the region of your choice. The closer the server is to your users, the faster the response time will be. Xano uses Google Cloud under the hood, so if you don't see a region that is listed on their [supported regions page](https://cloud.google.com/about/locations), please contact support. If there is enough demand, we will open a new region.
2. **Optimize Database Performance** Review our best practices for [Database Performance and Maintenance](/the-database/database-performance-and-maintenance). Proper indexing, query optimization, and regular maintenance can significantly improve performance.
3. **Simplify your Function Stack** This may seem obvious, but producing a response in ten (10) functions is slower than doing it in three (3). It's also important to remember that the number of functions in the function stack could be different than the statements that get executed (for example, if you have a loop).
4. [**Use Addons when requesting related data**](/the-function-stack/functions/database-requests/query-all-records#using-addons) Addons are Xano's way of enriching the response of a Database query without a heavy volume of requests. As a simple example, let's say you want to get 100 unique books and their associated 100 unique authors. Normally that would be 101 requests (1 request for all books, and a request to retrieve each author). With the magic of Addons, it's only 2 requests (1 to get the books, 1 to enrich the authors).
5. [**Use Data Caching**](/the-function-stack/functions/data-caching-redis) When working with large datasets or external API endpoints that have a rate limit/cost associated with them. (request caching, function caching, redis caching).
6. [**Use the Stream return type**](/the-function-stack/functions/database-requests/query-all-records#output) when looping through large sets of data. This will retrieve your records in a memory-efficient way.
7. [**Use Expressions for data transformations**](/the-function-stack/data-types/expression) Expressions are optimized for performance and can often replace multiple statements with a single expression.
8. **Use the Logic Assistant to find optimization opportunities** The Logic Assistant analyzes your function stacks and provides recommendations for improving performance and efficiency. Click the Logic Assistant button in the visual builder to get started.
 | Key | What is it? | What's it for? |
| ----- | -------------------------------------------------------------------------------------------------------------------------------------------------------------------------------------------------------------------------------------------------------------------------------------------------------------------------------------------------------------------------------------------------------------------------------------------------------------------------------------------------------------------------------------------------------------------------------------------------------------------------------------------------------------------------------------------------------------------------------------------------------------------------------------------------------------------------------------------------------------------------------------------------------------------------------------------------------------------------------------------------------------------------------------------------------------------------------------------------------------------------------------------------------------------------------------------------------------------------------------------------------------------------------------------------------------------------------------------------------------------------------------------------------------------------------------------------------------------------------------------------------------------------------------------------------------------------------------------------------------- | ------------------------------------------------------------------------------------------------------------------------------------------------------------------------------------------------------------------------------------------------------------------------------------------------------------------------------------- |
| **1** |
| Key | What is it? | What's it for? |
| ----- | -------------------------------------------------------------------------------------------------------------------------------------------------------------------------------------------------------------------------------------------------------------------------------------------------------------------------------------------------------------------------------------------------------------------------------------------------------------------------------------------------------------------------------------------------------------------------------------------------------------------------------------------------------------------------------------------------------------------------------------------------------------------------------------------------------------------------------------------------------------------------------------------------------------------------------------------------------------------------------------------------------------------------------------------------------------------------------------------------------------------------------------------------------------------------------------------------------------------------------------------------------------------------------------------------------------------------------------------------------------------------------------------------------------------------------------------------------------------------------------------------------------------------------------------------------------------------------------------------------------- | ------------------------------------------------------------------------------------------------------------------------------------------------------------------------------------------------------------------------------------------------------------------------------------------------------------------------------------- |
| **1** |  | Choose a period of time to view data from |
| **2** |
| Choose a period of time to view data from |
| **2** |  | Refresh available data |
| **3** |
| Refresh available data |
| **3** |  | Choose the type of statistics returned — Average: the average execution time of that function or function stack in the selected period of time; Count: the number of times the function or function stack was executed; Total Time: the total time of all executions of the function or function stack in the selected period of time |
| **4** |
| Choose the type of statistics returned — Average: the average execution time of that function or function stack in the selected period of time; Count: the number of times the function or function stack was executed; Total Time: the total time of all executions of the function or function stack in the selected period of time |
| **4** | 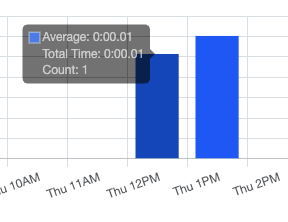 | Hover over any part of the chart to see specific statistics about that time period. |
| |
| Hover over any part of the chart to see specific statistics about that time period. |
| |  | In some views, you'll be able to split the bar in the graph by function or function stack. |
| **5** |
| In some views, you'll be able to split the bar in the graph by function or function stack. |
| **5** | 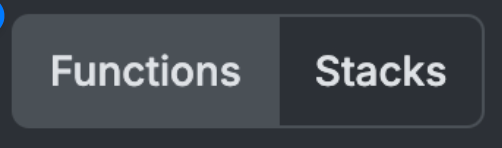 | Filter the graph and list of data to show either individual function calls, or function stacks. |
| **6** |
| Filter the graph and list of data to show either individual function calls, or function stacks. |
| **6** |  | Filter the data by function types, or function stack types. |
| **7** |
| Filter the data by function types, or function stack types. |
| **7** | 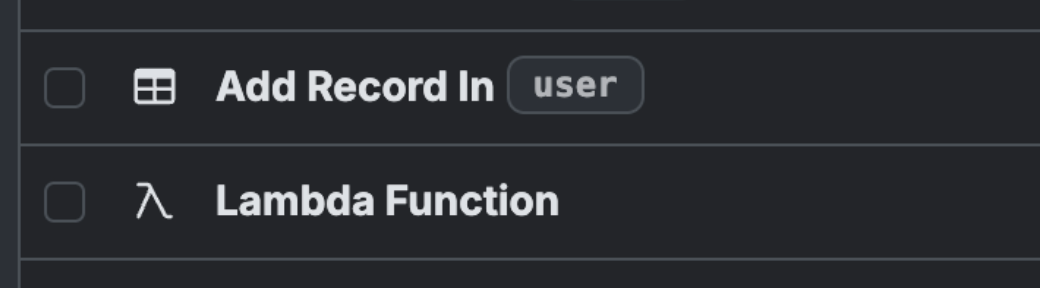 | In the list, you can click on the individual function or function stack to jump right to where it is in your workspace. |
Once you've identified specific functions or workflows to address, you can take steps to optimize them. Consider the following optimization techniques:
1. **Get a dedicated instance in a region that's closest to your customers**
| In the list, you can click on the individual function or function stack to jump right to where it is in your workspace. |
Once you've identified specific functions or workflows to address, you can take steps to optimize them. Consider the following optimization techniques:
1. **Get a dedicated instance in a region that's closest to your customers**