Quick summaryDeployment readiness is the work you do before sending production traffic to your backend: reviewing performance, building and running tests, validating workflows against safe data, and — if traffic warrants it — load testing. This page is the performance and reliability companion to the Pre-Launch Security Checklist. You should work through both before you launch.
X-Data-Source header.
When to use this guide
Work through this guide when you are:- About to point production traffic at a new Xano workspace or instance for the first time
- Releasing a significant feature that changes critical endpoints, schema, or background tasks
- Migrating from a sandbox or trial workspace to a paid plan
- Preparing for a marketing launch, partner integration, or any event that could change your traffic shape
- Re-evaluating an existing production backend after sustained growth or recurring incidents
The readiness flow
You’ll move from narrow, fast checks to broader, slower ones. Each layer builds on the previous:- Review performance baselines — understand how your backend behaves today.
- Build unit tests and workflow tests — lock in correct behavior for individual endpoints and end-to-end flows.
- Dry-run with a test data source — exercise your application against safe data that mirrors production.
- Load test (if traffic warrants it) — confirm the backend holds up under realistic concurrency.
Review performance baselines
Why this matters
Performance issues that look minor in development can dominate latency in production. Reviewing your current baselines gives you a real picture of which endpoints are slow, which are hot, and which are both — the third category is where launch problems concentrate.What to check
- Average execution time for high-traffic endpoints
- The slowest database queries, especially Query All Records operations
- External API calls and Lambda functions — these add latency outside your direct control
- Background tasks that process large datasets
- Endpoints that return large payloads
How to do it in Xano
1
Open Performance Insights
From the sidebar, switch to the Monitor tab and select Performance Insights.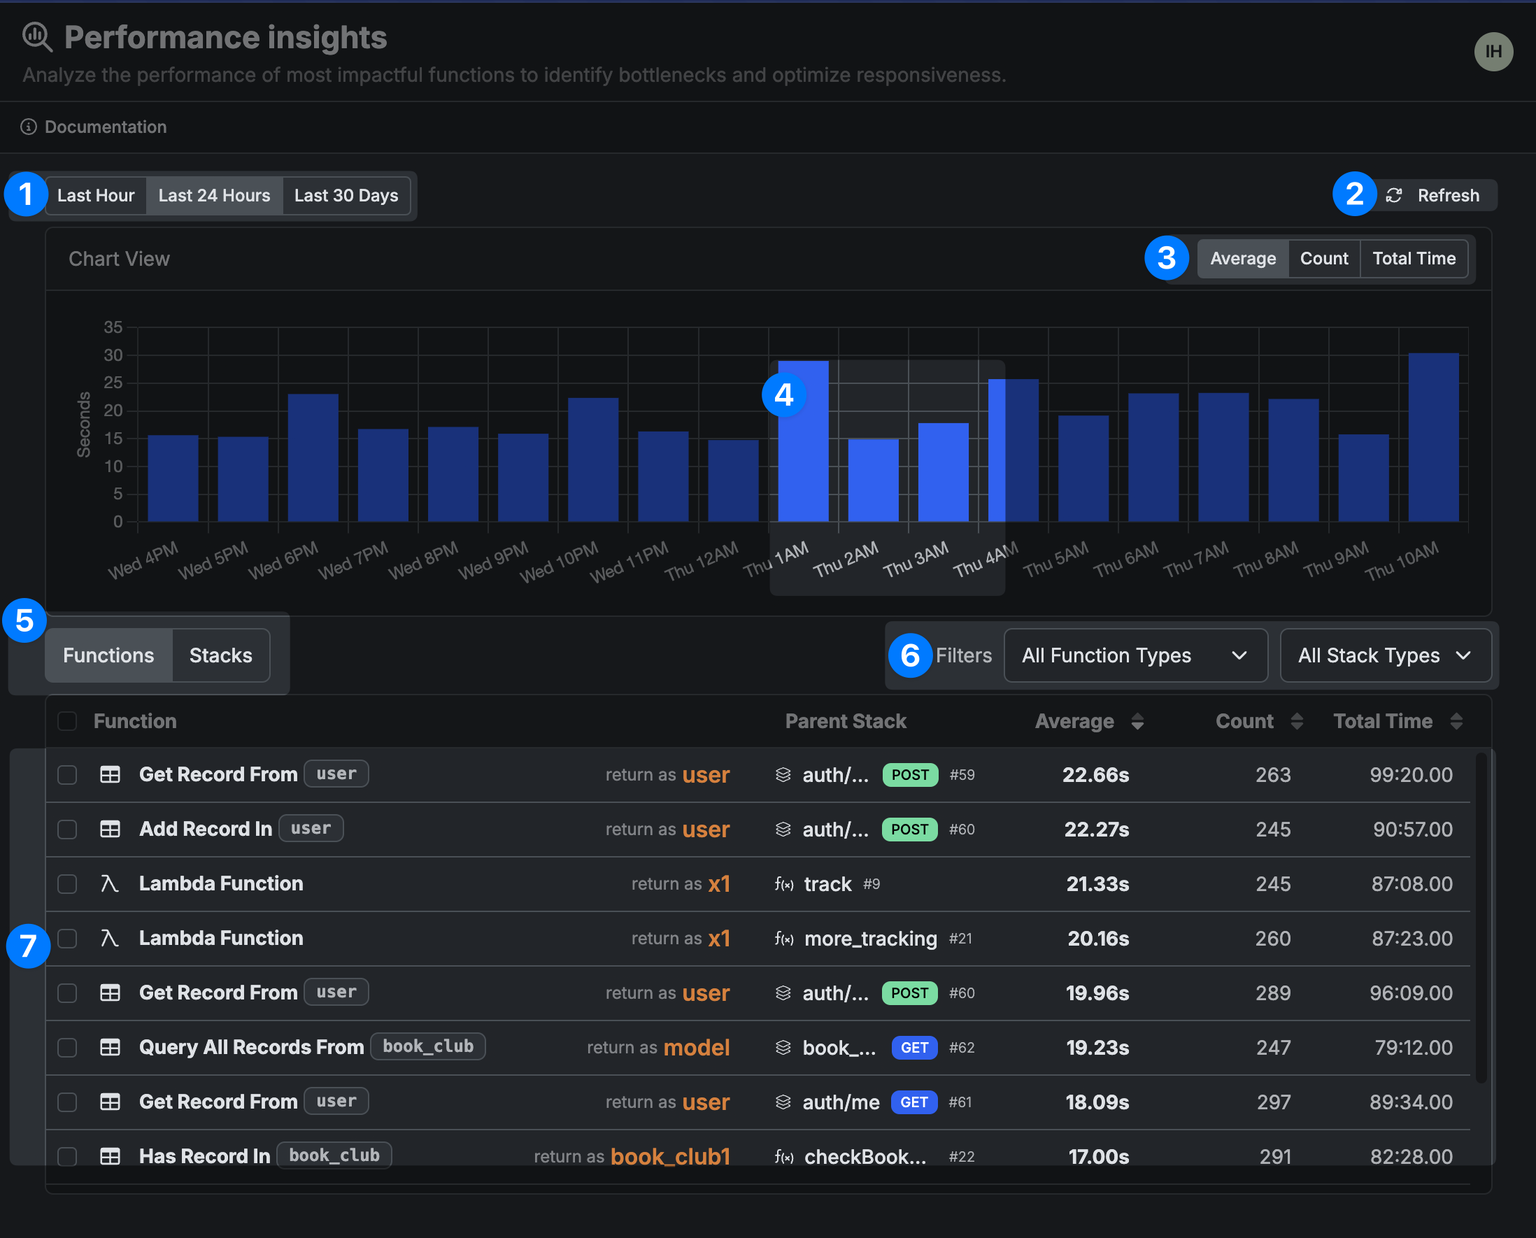
2
Pick a representative time window
Use 24 hours for very active workspaces and 7 or 30 days for newer ones. Aim for a window that reflects realistic usage patterns rather than a quiet period.
3
Sort by both Average Execution Time and Total Execution Count
The slowest endpoints matter, but so do the busiest. The intersection of slow and busy is where to start optimization work.
4
Cross-reference with Request History
Open Request History to see individual responses, input and output sizes, and any error responses. Filter by duration to spot outliers that don’t show up clearly in averages.
What to look for
- Endpoints that exceed your expected response budget for their use case (an interactive UI tolerates much less latency than a background sync)
- Query All Records calls without filters, pagination, or indexes
- Repeated external API calls that could be batched, cached, or moved to a background task
- Endpoints with spiky latency rather than steady response times — spikes often point to lock contention or external dependency variability
- Background tasks whose runtime is creeping up over time
Common issues to fix
- Unbounded Query All Records — add filters, pagination, or indexes
- External API calls inside loops — batch, cache, or move them to background work
- Function stacks fetching more data than they use — trim the response shape
- Synchronous handlers doing heavy work that belongs in a background task
- Missing indexes on columns used for filters, joins, or sorts
Before moving on
You should understand which endpoints will see the most traffic, how fast they run today, and which slow paths you’ve fixed or knowingly deferred.Build unit tests and workflow tests
Tests are the cheapest place to catch regressions. Xano provides two kinds, and they answer different questions.
You want both. Unit tests catch logic errors quickly, in isolation. Workflow tests catch the integration problems that only appear when steps depend on each other — wrong handoff between endpoints, missing fields, broken state transitions.
Why this matters
Without tests, every deployment is a hope. Tests turn deployment into a verifiable claim: the behavior you depended on yesterday still works today. They also become essential the moment more than one person edits the backend.What to check
Make sure each of these is covered:- Critical paths — the small set of flows your business cannot afford to have broken. Concrete examples:
- Authentication: sign up, log in, password reset, token refresh
- Money: checkout, refund, subscription change
- Data integrity: any endpoint that writes to a table referenced by other tables
- Communications: order confirmation emails, notification webhooks
- Error branches — invalid inputs, missing required fields, expired tokens, denied permissions
- Edge cases for your data shape — empty strings, null values, maximum-length inputs, unusually large arrays
How to do it in Xano
1
Create unit tests for critical endpoints and functions
From any API endpoint or custom function, use Run & Debug with a known input. When you have the result you expect, click Create Unit Test.Define Expects statements to assert the response shape — for example, 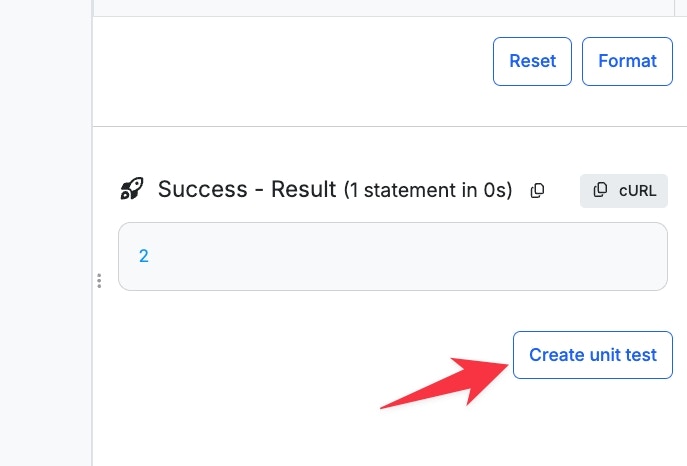
response.authToken is defined or response.user.id is a number. Add multiple Expects to cover the parts of the response your callers depend on. See Unit Tests for the full reference, including mocking external responses so tests don’t depend on third-party uptime.2
Build workflow tests for multi-step user flows
From the Test & Deploy tab, open Workflow Tests and create a new test suite. Add Run Stack steps to call APIs in the order a real user would, and Test Expression steps between them to assert that the right state moved forward.Useful workflow examples: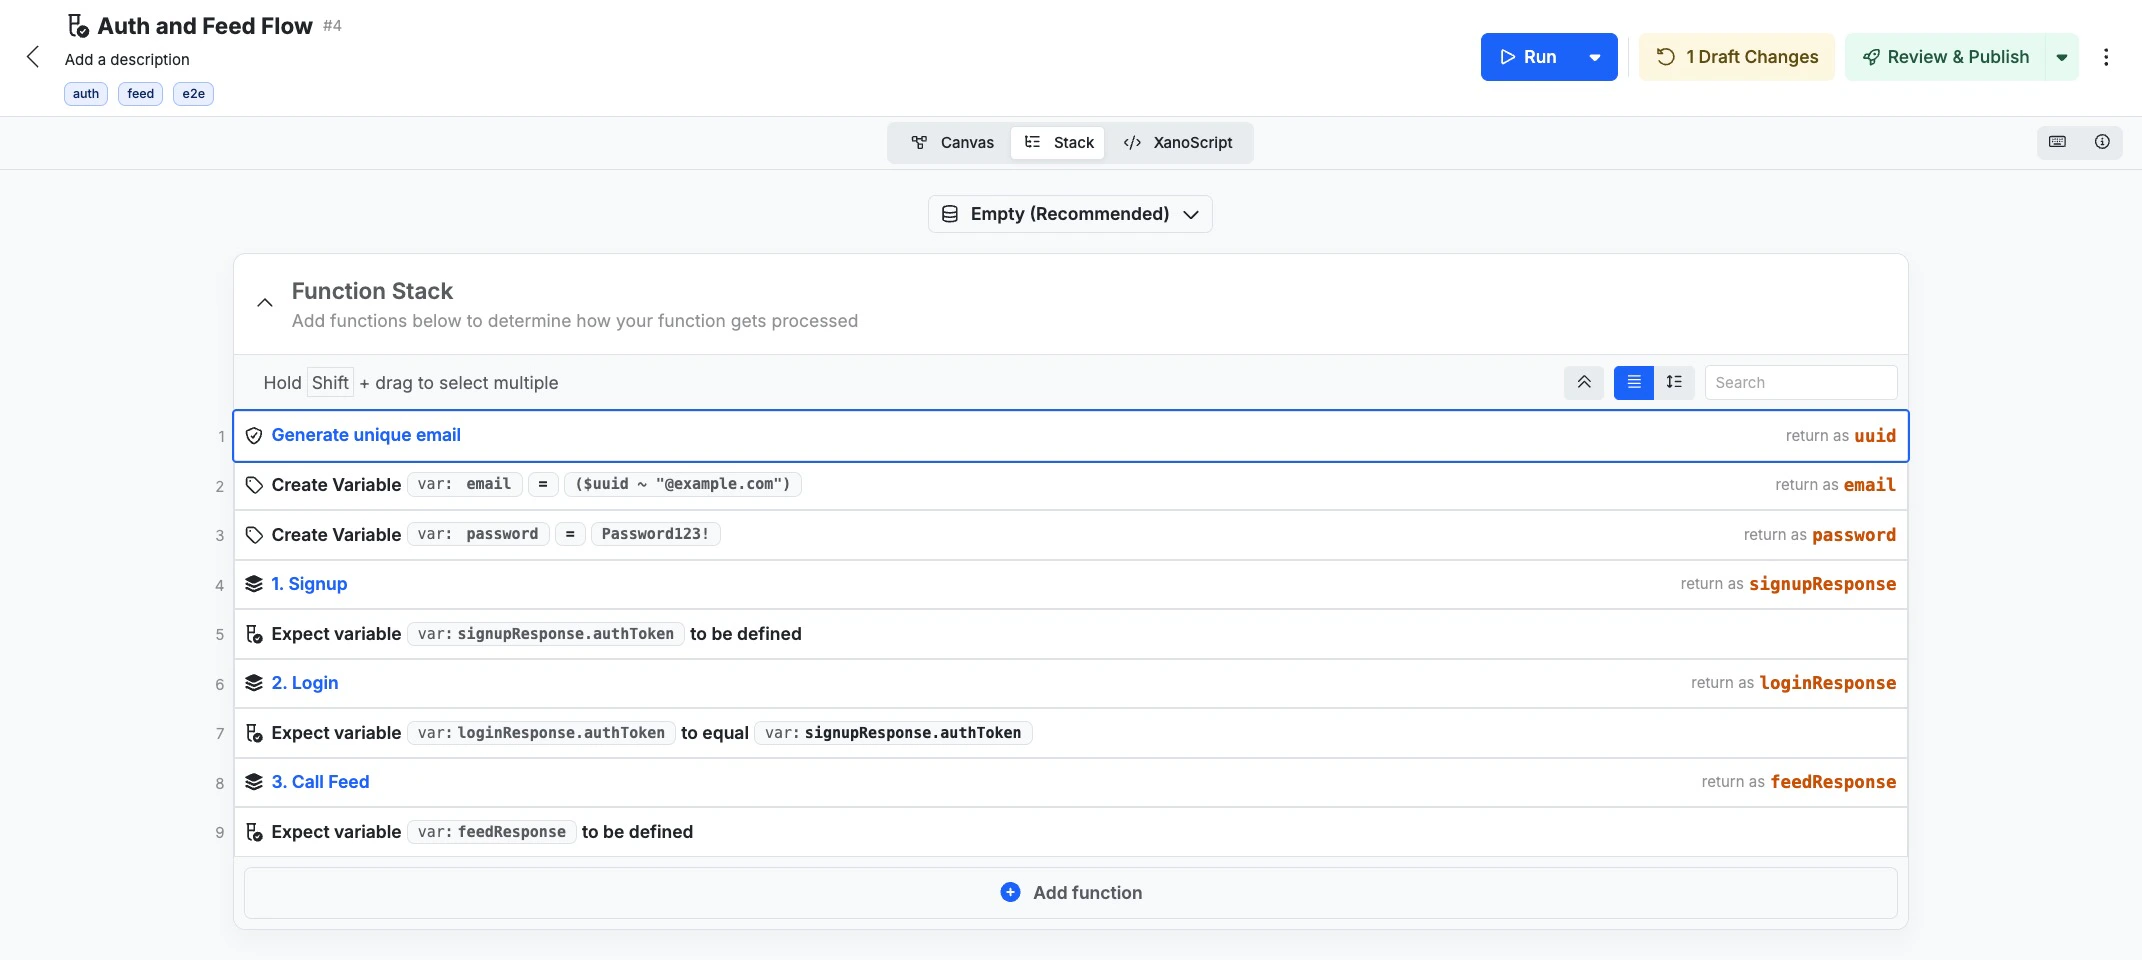
- Sign up → email verification → profile setup
- Add to cart → apply coupon → checkout → payment → order confirmation
- File upload → background processing → status check → export
3
Run everything together and read the results
From Unit Tests in the Test & Deploy tab, click Run Test Suites to execute every test. The results page shows coverage (the share of function stacks that have tests) and success rate.Filter by Failed Only when you’re triaging. Treat any new failure as a blocker until you’ve either fixed it or explicitly accepted it.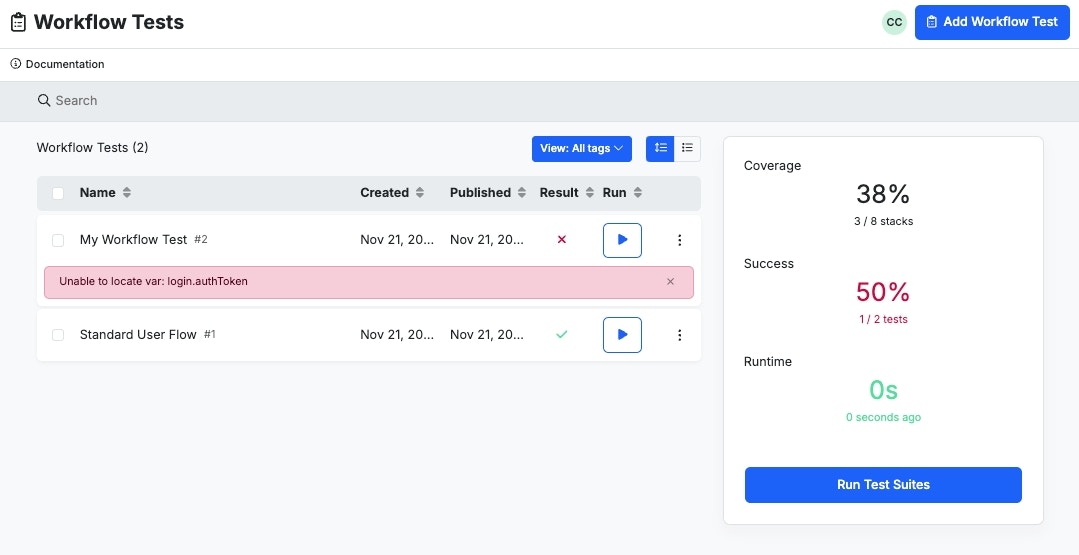
What to look for
- Every critical path has at least one workflow test and unit tests covering its underlying endpoints
- Failure scenarios are tested, not only happy paths
- External dependencies are mocked so test results don’t fluctuate with third-party availability
- The full suite runs cleanly end-to-end, not just individual tests in isolation
Common issues to fix
- Workflow tests that share state and pass only when run in a specific order — make each test set up its own data
- Tests that depend on auth tokens which expire — refresh tokens as part of test setup
- Coverage numbers driven by trivial tests on non-critical functions while critical paths remain uncovered
- Flaky tests left in the suite — fix or quarantine them, don’t ignore them
Before moving on
You should be able to run the full suite and read the results without surprise. Every critical path should be covered by tests, and you should know which failures (if any) you’ve decided are acceptable for launch.Use test data sources to dry-run your application
Never iterate on live production data. Xano Data Sources let you keep separate, isolated copies of your database so you can develop, test, and dry-run safely.Why this matters
A test data source removes the worst class of mistakes — destructive operations that touch real customer records. It also speeds up iteration, because you can reset state freely and exercise edge cases without fear of corrupting production.What to check
- A dedicated test data source exists and is clearly distinguished from live (Xano lets you assign a color to each data source — use it)
- The data inside reflects the shape of production well enough to surface real problems
- Your tests, manual dry-runs, and any test frontend point at the test data source, not at live
How to do it in Xano
1
Create a test data source
Click your data source indicator in the status footer (e.g., “Live”), then + Add Data Source. Name it descriptively (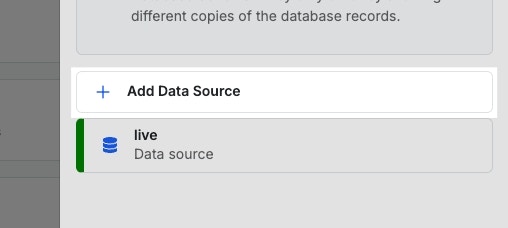
Test, Staging, QA) and assign a distinct color — Xano will surface that color throughout the UI so you can see at a glance which data source you’re working against.2
Populate it
Choose the approach that matches what you’re testing.Migrate from live — use Manage Data Sources → Migrate to copy tables from live into your test source. Best when you need realistic shape and volume, and your live data isn’t sensitive enough to require redaction. Watch out for personally identifiable information; consider migrating a subset or scrubbing fields before testing.Create sample data — manually insert representative records. Best when live data is sensitive, doesn’t exist yet, or doesn’t cover the edge cases you want to test. Include the awkward shapes deliberately: empty strings, nulls, maximum lengths, very long arrays, unicode.Start empty — use an empty data source when your tests are responsible for creating all the data they need (most workflow tests fit here). The benefit is reproducibility: every test run starts from the same known state.For most teams, a combination works best — a migrated-and-scrubbed source for manual exploration, and an empty source that workflow tests populate themselves.
3
Switch to the test data source for development work
Click the data source indicator and select your test source. Run & Debug, unit tests, and workflow tests will now run against it.
Switching your data source in Xano only affects your development environment. Your live application keeps reading and writing to the live data source until you tell it otherwise.
4
Dry-run your application end to end
Walk through real user journeys using Run & Debug, then run your unit and workflow test suites. Try destructive operations — bulk deletes, schema migrations, mass updates — that you’d never test against live data.
Pointing a frontend at the test data source
If you have a staging or test build of your frontend, you can route its API traffic to the test data source without maintaining a second backend. Xano honors a data source override on every request:- Header (preferred for code): set
X-Data-Source: testin your HTTP client’s default headers. Every request from that build will read and write against thetestdata source. - Query string (preferred for ad-hoc checks): append
?x-data-source=testto a URL. Useful for sharing a one-off test link or debugging in a browser.
test with whatever you named your test data source.
What to look for
- Tests and dry-runs hit the test data source, not live (the color indicator in the UI is your fastest check)
- The test data source has enough variety to exercise the edge cases your code claims to handle
- A staging frontend, if you have one, sends the
X-Data-Sourceheader on every request - Live frontend requests still have no override and continue to hit live
Common issues to fix
- Forgetting to switch back — long sessions can drift between data sources without you noticing. The color indicator is there to prevent this; use it
- Stale test data that no longer matches the current schema after migrations — refresh or rebuild it
- Sensitive production data copied into a test source without scrubbing — treat test sources as having the same access controls as live until you’ve removed sensitive fields
- Workflow tests that depend on data that only exists in one developer’s local test source — make tests set up their own data
Before moving on
You should have a clearly-marked test data source, at least one way of populating it that matches your testing needs, and confidence that nothing you’re doing during dry-runs can reach live data.Load testing
Load testing simulates concurrent users hitting your backend and tells you whether response times, error rates, and throughput hold up under realistic traffic. Xano does not include built-in load testing — you’ll use an external tool.When load testing is necessary
You probably want to load test if any of these apply:- A marketing launch, press placement, or campaign that could produce a traffic spike
- A public, unauthenticated endpoint (sign-ups, search, public APIs) that anyone can hit
- A partner integration that will send batched or sustained traffic
- A move between Scale tiers, especially upward — you want to confirm the new tier behaves as expected before you depend on it
- Recurring slow-response complaints that you can’t reproduce with synthetic single-request tests
What to check
- Response times under realistic concurrency, not just single-request latency
- Error rates, including which status codes appear (429s and 5xx are particularly informative)
- Throughput — how many requests per second the backend sustains before degrading
- Whether degradation is graceful (response times rise) or abrupt (errors spike)
How to do it in Xano
1
Choose a load testing tool
Common options:
- Apache JMeter — open-source, highly configurable
- Artillery — YAML-based, developer-friendly
- k6 — JavaScript-based, scriptable
- Loader.io — cloud-based, low setup
- BlazeMeter — enterprise, JMeter-compatible
2
Design scenarios that mirror real usage
A useful load test reflects what users actually do, not raw RPS against one endpoint.Decide:
- Concurrent users — how many simultaneous sessions you expect at peak
- Request mix — which endpoints get hit and in what ratio
- Ramp-up — how quickly traffic builds, not just the steady-state target
- Duration — long enough to surface issues that don’t appear in the first thirty seconds (connection pool exhaustion, slow memory creep)
3
Point the test at staging, not production
Load testing against live traffic is rarely what you want. Use a test branch, staging workspace, or — on plans that allow it — a separate instance via Xano Link. Branching options are covered in Branching & Merging.Make sure the staging environment matches production as closely as possible — same Scale tier, same data shape, same external integrations or realistic mocks.
4
Watch Xano-specific signals while the test runs
Open these in separate tabs and watch them live:
- Performance Insights — does p95 execution time stay flat as concurrency rises, or climb?
- Request History — what error codes appear, and on which endpoints? 429 responses indicate rate limiting; 5xx responses indicate something gave up
- Statement Explorer — which database statements are slow under load, and are they the same ones that were slow at low load?
- API and database node utilization — available on higher-tier plans; tells you which side of the backend is saturating first
5
Analyze, fix, and re-run
If response times degrade or errors spike, the earlier sections of this guide are where you fix it: optimize the slow paths Performance Insights surfaces, address any logic errors the test exposes, and adjust your Scale plan if you’re hitting node-level limits. Then re-run the same scenario to confirm the change moved the numbers.
What to look for
- Response times that stay within budget across the full ramp, not just at the start
- Error rates that stay low and don’t climb sharply at peak concurrency
- Throughput that grows roughly linearly with concurrency until you reach the saturation point you expect
- No single endpoint absorbing a disproportionate share of latency or errors under load
Common issues to fix
- A single slow endpoint dragging tail latency for everything — isolate and optimize it
- Connection-pool or external-dependency limits surfacing only at scale — adjust pool sizes or batch upstream calls
- Background tasks competing with synchronous request handlers for resources — separate them where you can
- Hitting Scale tier limits earlier than expected — review tier sizing before launch, not during
Before moving on
You should know how much concurrency your backend handles cleanly, where it starts to degrade, and what happens at the edge of its capacity. If you’ve sized your Scale plan for expected peak with reasonable headroom, you’re in good shape.How the layers fit together
Each layer in this guide validates a different question, and each one builds on the one below it. Working through them in order is what keeps issues cheap to fix.
The order matters. Fixing a logic bug is much cheaper at the unit-test layer than discovering it under load. Each layer is a filter that catches a different class of problem before the next layer would have to.
This flow also maps naturally onto a CI/CD setup — see CI/CD for the broader pipeline view.
Deployment readiness checklist
Work through this before pointing production traffic at the backend. Group the items by category so you can divide the work across a team. Performance- Reviewed Performance Insights over a representative window
- Identified the slowest endpoints and the busiest endpoints, and prioritized work where the two overlap
- Optimized or knowingly deferred each slow path
- Reviewed Request History for unexpected errors or large payloads
- Unit tests exist for the critical endpoints and functions you identified
- Workflow tests cover the critical multi-step user journeys
- Failure branches are tested, not only happy paths
- External dependencies are mocked where they would otherwise make tests flaky
- The full suite runs end-to-end without surprise failures
- A dedicated test data source exists, distinct from live and visually distinguished
- Test data reflects realistic shapes and includes the edge cases your code claims to handle
- Sensitive fields copied from live have been scrubbed or excluded
- Any staging frontend points at the test data source via
X-Data-Source, and production traffic still hits live
- A branching strategy is in place for ongoing deployments
- Drafted work intended for launch has been published
- OpenAPI documentation is reviewed and accurate
- The Pre-Launch Security Checklist has been completed
- Expected peak traffic is documented
- Your Scale plan is sized for that peak with reasonable headroom
- If a traffic spike is expected at launch, load testing has been performed against staging
- You’ve decided how you’ll monitor production after launch (Performance Insights, Request History, Statement Explorer)
Common deployment readiness mistakes
- Testing only happy paths. Production traffic exercises the error branches too. Cover invalid inputs, missing fields, expired tokens, and denied permissions explicitly.
- Treating workflow tests as a replacement for unit tests. Workflow tests are slow and hard to debug when they fail; unit tests are where you isolate logic. You need both.
- Running tests or dry-runs against live data. Even read-only flows can produce surprising writes through triggers or related endpoints. Switch to a test data source.
- Aiming for a coverage number rather than coverage of what matters. High coverage on trivial functions while critical paths are untested looks reassuring but isn’t.
- Skipping load testing because traffic is small today. A baseline test now tells you where the saturation point is before you depend on knowing it. Small now and large at launch is exactly when you want the data.
- Forgetting that schema changes invalidate prior test results. After any schema migration, re-run the suite — assumptions about field shapes may no longer hold.
- Treating deployment readiness as separate from security readiness. A backend can be fast, well-tested, and still expose endpoints it shouldn’t. Work through the Pre-Launch Security Checklist alongside this one.
- Letting flaky tests stay in the suite. Tests that pass on retry train the team to ignore failures. Fix them, quarantine them, or remove them — don’t tolerate them.
Next steps
Once you’ve worked through this guide:- Publish drafted changes so your live environment reflects the version you’ve validated.
- Confirm your branching strategy for ongoing work — see Branching & Merging.
- Connect your frontend following the Connecting to a Frontend guide, and verify that production traffic routes to live (not test) by default.
- Set up ongoing monitoring with Request History and Performance Insights, and decide what changes in those views would prompt you to investigate.
- Re-run this checklist before significant releases. Deployment readiness is a practice, not a one-time event.