What can I see with Performance Insights?
Performance Insights enable you to analyze performance of specific function stacks or function types across your entire workspace. You’ll be able to easily answer questions like:- How long does a specific Lambda function take to run, on average, over the last 24 hours?
- What are my top 5 most resource intensive database queries?
- How many times did we run a bulk database operation over the last 30 days?
How do I use Performance Insights?
From the sidebar, switch to the Monitor tab and select Performance Insights. Use the image below and the table to learn more about each section of the Performance Insights screen.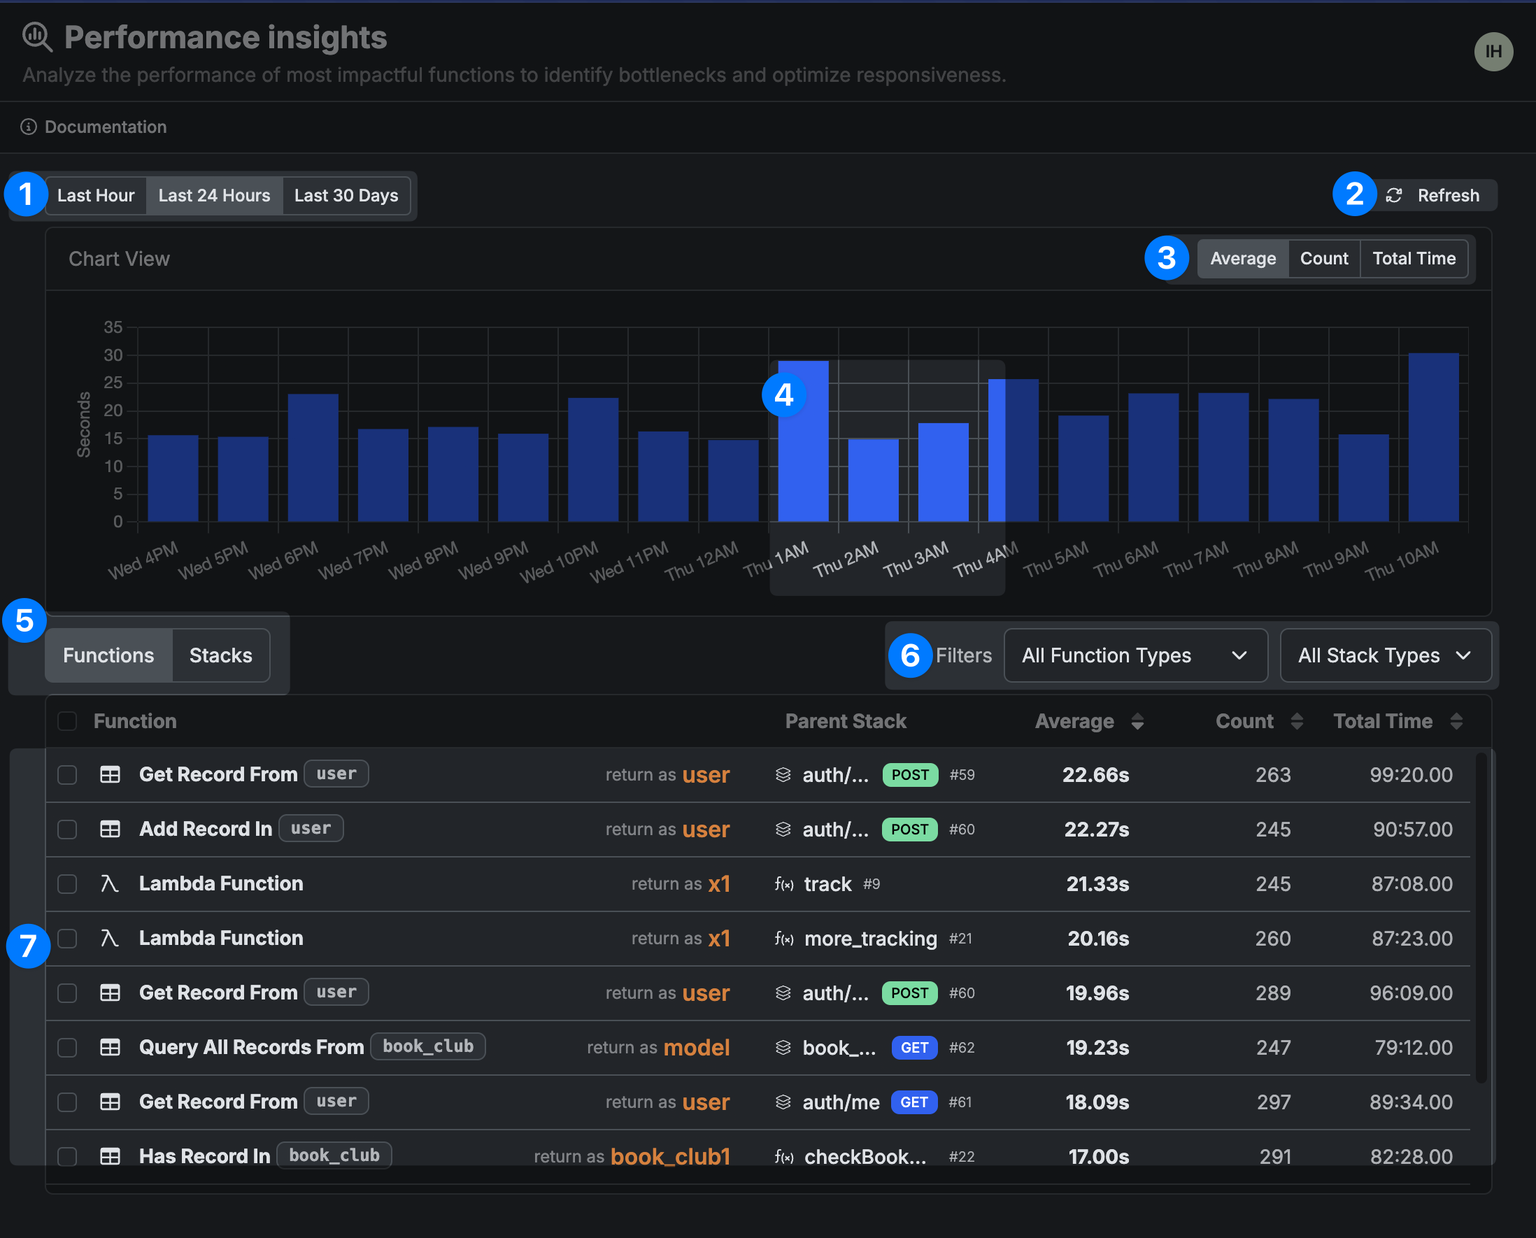
| Key | What is it? | What’s it for? |
|---|---|---|
| 1 | 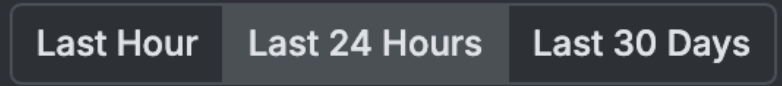 | Choose a period of time to view data from |
| 2 |  | Refresh available data |
| 3 | 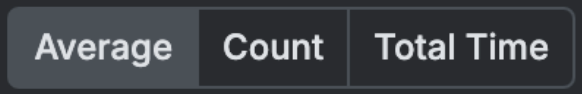 | Choose the type of statistics returned — Average: the average execution time of that function or function stack in the selected period of time; Count: the number of times the function or function stack was executed; Total Time: the total time of all executions of the function or function stack in the selected period of time |
| 4 | 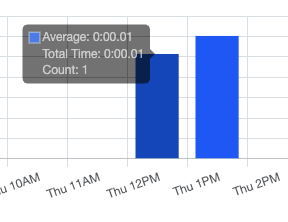 | Hover over any part of the chart to see specific statistics about that time period. |
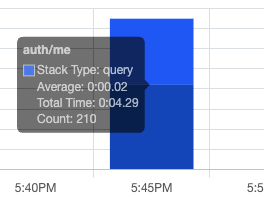 | In some views, you’ll be able to split the bar in the graph by function or function stack. | |
| 5 | 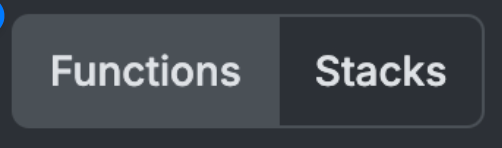 | Filter the graph and list of data to show either individual function calls, or function stacks. |
| 6 |  | Filter the data by function types, or function stack types. |
| 7 | 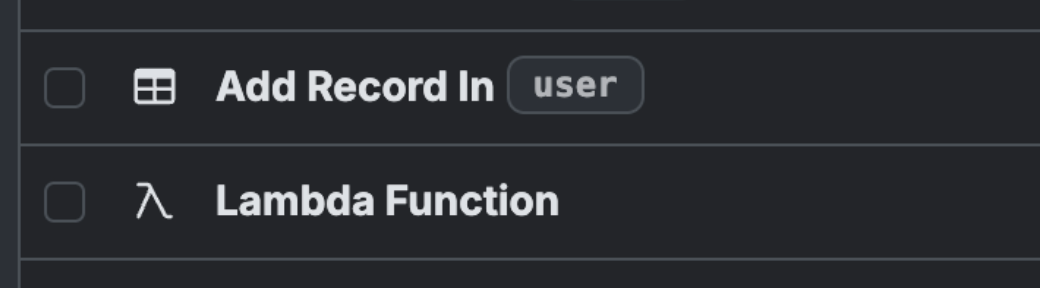 | In the list, you can click on the individual function or function stack to jump right to where it is in your workspace. |
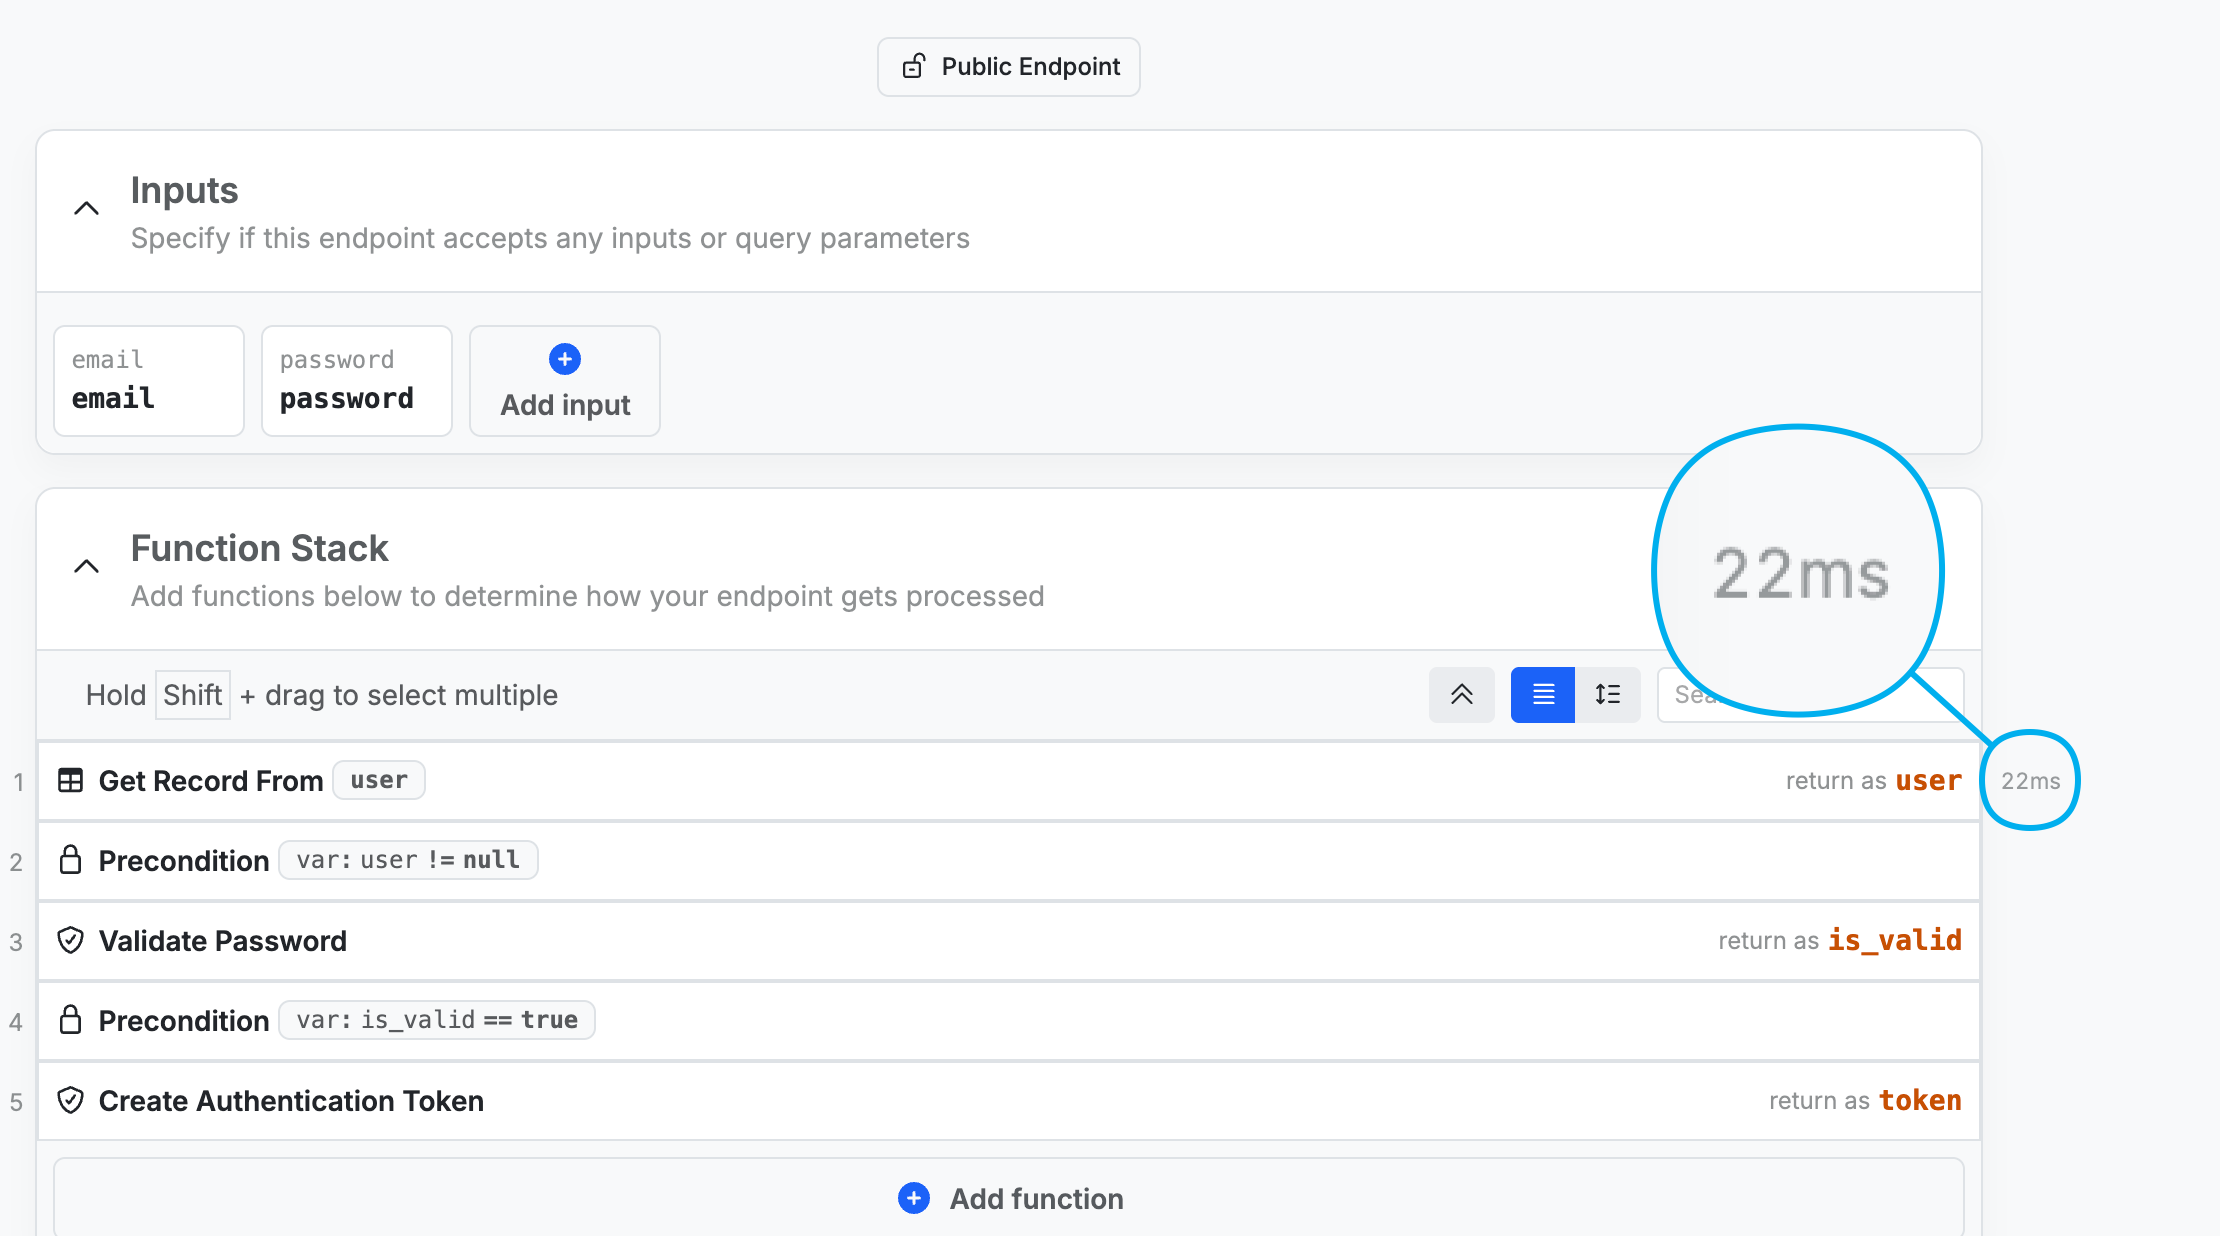
Get quick visibility into the average length of time certain statements take to execute by viewing the logic in the Stack view.