- Temporary system restarts and downtime
- Slow performance
- Failed requests
Reducing RAM Usage
If you are finding yourself in a situation where you are experiencing symptoms of RAM exhaustion, there are a few things you can to do try and mitigate the situation. It’s important to note that in some cases, when mitigation is not possible, that may signal it’s time to upgrade your Xano subscription tier to increase your available RAM. You can always reach out to Xano Support for further clarification.Database RAM
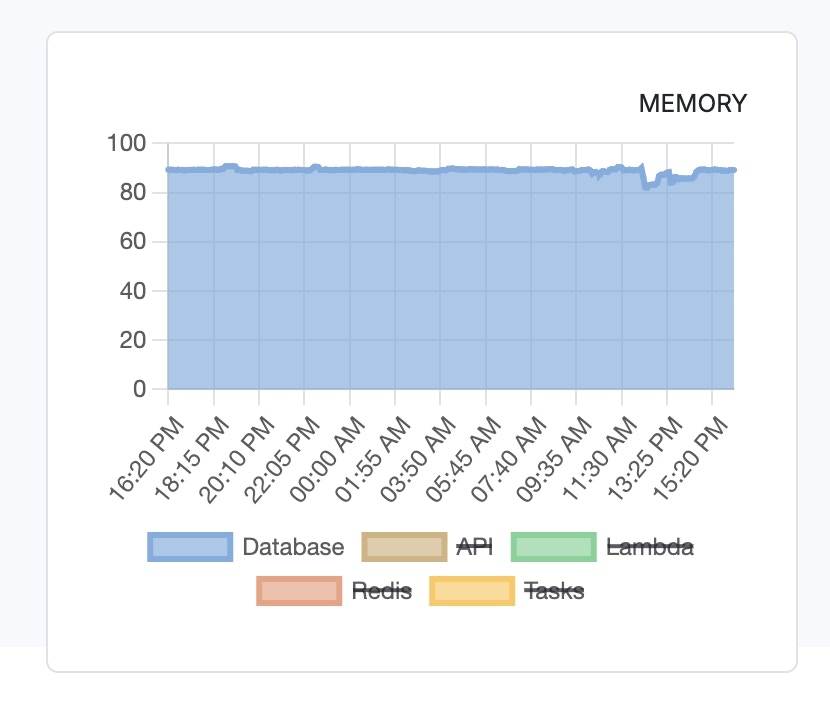
Spikes in Database RAM can be caused by one or more of the following:-
Tables that contain fields with large amounts of data, such as JSON payloads or sizable text content
- Try moving these large fields to a separate table or determining if you can reduce the amount of data stored.
- Depending on how often the data needs to be accessed, you can also store the large data in text files and store the file path in the table instead.
-
Table references to other tables with a high number of fields
- Use the Auto Complete setting on the referenced table to reduce the amount of data loaded when viewing the table
-
Running queries with joins on large tables
- Make sure you are using proper indexing on large tables
- Use pagination on your base query
API RAM
Spikes in API RAM can be caused by one or more of the following:-
Function stacks that process large volumes of data
- Clear the contents of variables as they become unnecessary by updating them to blank values
- Move large data processing jobs to background tasks
- Use post processing to execute any functions that aren’t necessary to deliver a response
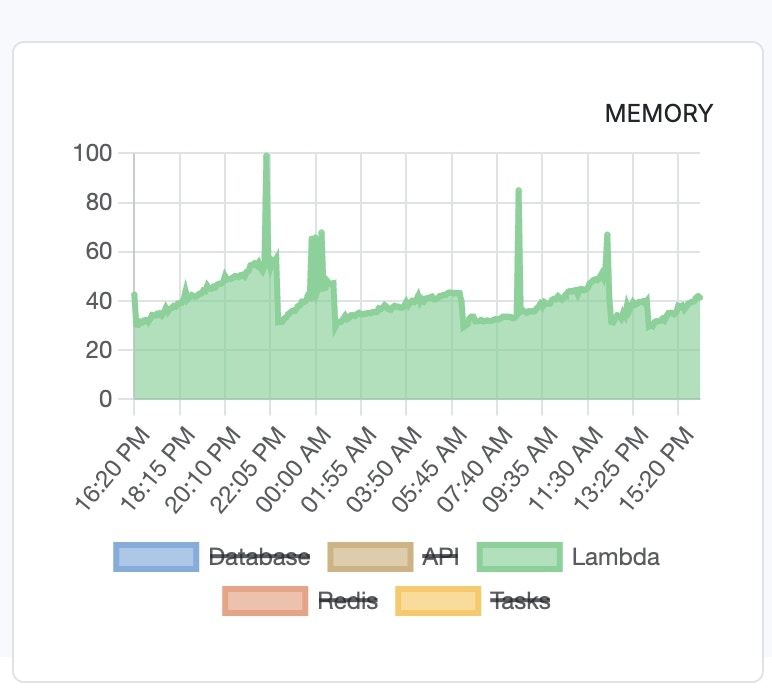
Lambda RAM
Spikes in Lambda RAM are incredibly rare, and we would recommend reaching out to support if you see this happen. Lambda is only used for internal instance operability, such as facilitating Realtime.Deno RAM
Please note that when using Lambda functions, the contents of all variables are loaded into Deno memory. This is most often the cause of memory issues when using Lambda functions, and can be mitigated by wrapping your Lambda in a custom function giving it access to only the data it needs to run. Spikes in Deno RAM can be caused by one or more of the following:- Contents of other variables are too large for the Lambda to handle during processing
- Using file resources in conjunction with Lambdas
-
Loading large or multiple NPM packages in your functions. Any library you call will be loaded into memory.
- If you use packages frequently, they may be retained in memory for increased speed.
- If you hit your RAM limit for Deno, the “pod” or section of your instance that is responsible for Lambda functions will clear memory and restart, which will potentially cause Out Of Memory errors or timeout errors.
Redis RAM
Spikes in Redis RAM can be caused by one or more of the following:- Heavy and/or inappropriate reliance on data caching functions