Request History
Last updated
Last updated
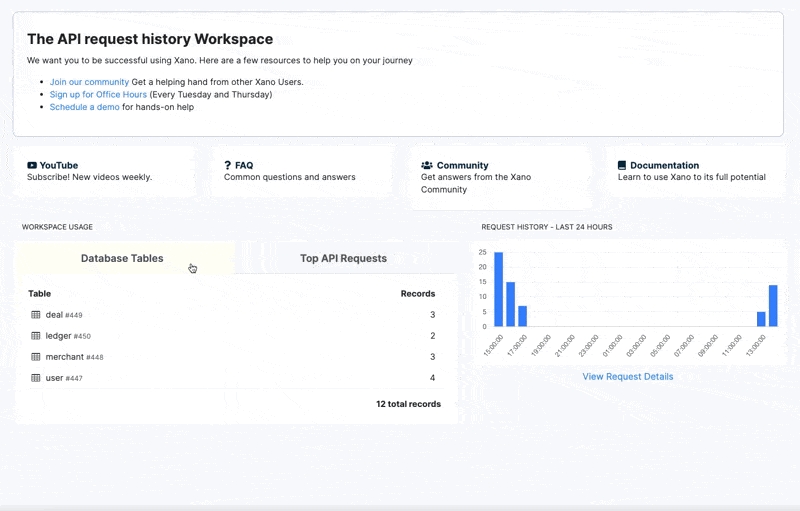
From the dashboard, easily view the high-level statistics of the API request history from your entire Workspace. You can toggle between your database and top API requests to see which of your API endpoints are being hit the most. To the right, visualize your API request history with a graph displaying the statistics of the past 24 hours. Select 'View Request Details' to see a detailed view and history of each API call made in your Workspace.
You can expand each individual call to review detailed information including inputs, response and request headers, and the output. You can even drill-down on a per-user basis to see the activity of each user in your application. Furthermore, you can view failed API calls here in order to help debug what went wrong. Finally, you can use these details to understand Webhook payloads to make it easier to build API endpoints that receive Webhooks.
You can also choose whether to see the request history for the specific branch you have active, or all branches, and download your request history as a CSV. If you would like to access your request history via API, you can do so using our Metadata API.
The Request History panel allows you to filter by the following metrics:
Time - when the request was received
Duration - how long the request took
Status - if there was a standard code returned, filter by that status
Input / Output Size - how much data was sent to or sent from the request
API and Custom Function request history panels will also show the average runtime of all of your requests, giving you quick visibility into the state of your application.
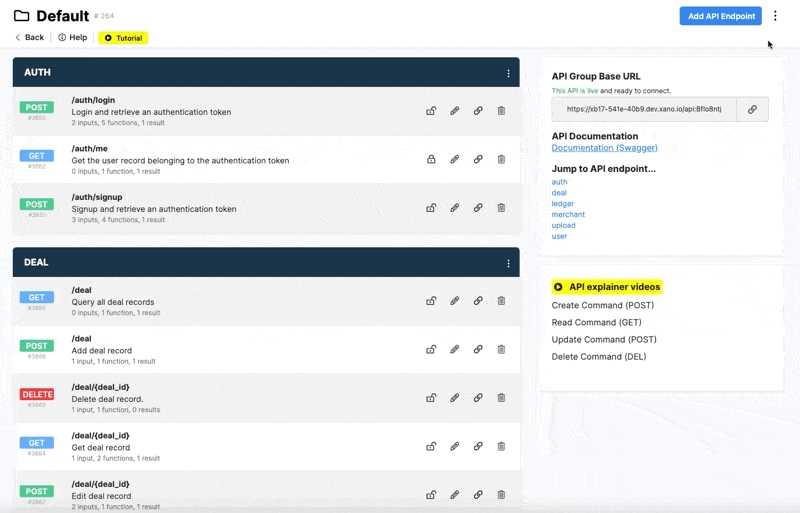
It doesn't stop at the entire Workspace level. From each API group, you can see the detailed history of the entire group. And from each API endpoint, you can see the history of the individual endpoint.
Custom Functions are similar to API endpoints in Xano, in the sense that they have the same No-Code API builder UI. However, custom functions can only be called by other internal function stacks in Xano whether that's an API, other function, or background task.
Functions also have a request history for any time a function is part of a live API request.
First, open the request history of a function from the top right menu icon.
Once opened, you can see all the requests from the past 24 hours.
At the top, you can filter the requests by the time they occurred up until and by the duration of the how long the function took to run.
The duration filter can be useful for identifying potential performance issues.
You can click on any of the requests to see the specific details of the inputs, output (response), and the function stack run time information.
Task history behaves a little differently than APIs and functions. Tasks maintain a history over 7 days instead of 24 hours. Tasks also do not deliver responses, so no response data will be recorded, but you will still be able to review the statement log, execution status, and the timing details.
Middleware history will behave the same as API and function history.
Request history for triggers behaves most similar to a task, as there is no output returned with a trigger. You can, however, review the inputs (new, old, action, datasource) and the timing details for each step.
In your workspace settings, you can manage the request history for your entire workspace in the Branch Defaults panel.
From this panel, we can define the request history defaults for each object type (query, function, task, middleware, trigger) that maintains history.
Enable / Disable - Performs the selected action on the object type
Function Statement Limit - The number of statements to record for each object type. You can choose between:
No statements
100 statements
1,000 statements
10,000 statements
Store all statements
Please note that request history utilizes your Database (SSD) storage. It is important to consider this when determining how many statements can be stored, or if they need to be stored at all.
In each individual API, function, task, middleware, or trigger's settings, you can also control the request history for that object specifically.
By default, these will be set to inherit, which means it will obey the branch defaults. Otherwise, you can adjust this for specific objects as necessary.
From your Instance settings, you have the option to manually clear your request history at any time.
From this panel, we have two options: database storage and cache storage.
This is the actual database table that contains all of your request history, and counts against your available database storage in your instance. You can click on this option to delete one portion or all of your request history at any time.
Use the Force option to halt any running processes to ensure the data can be cleared -- please note however that this may result in a little bit of downtime as the server halts running processes.
As requests are logged, they are not immediately saved to the database. For a short period of time, they are held in a cache, and dumped into the database at fast, regular intervals. In some cases, such as during excessive traffic spikes, you may find that clearing the request cache before the items are added to the database can help the recovery process.
Please note that when items are cleared from the cache, they will not be logged in the history database.


