Testing a Function Stack
1
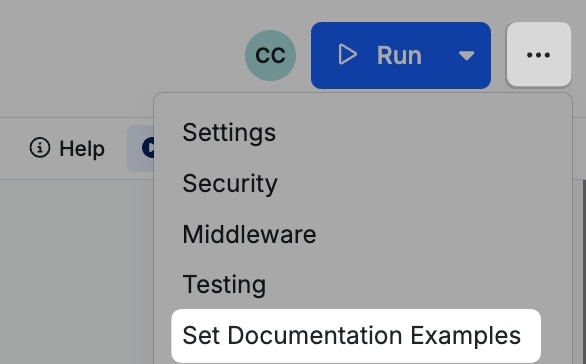
Click 'Run' at the top of your workflow to execute it.

2
Populate any necessary inputs.
This information will be used to test your workflow. If you’re copying and pasting JSON from another source, you can use the Format button to quickly turn it into a readable structure if necessary, although this will not impact the functionality of your test run.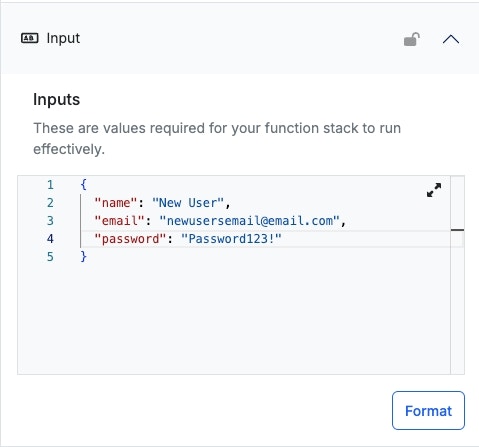
3
Click 'Run' to execute the workflow.
Hint - Running in Safe ModeIf you’re running into memory issues when running large function stacks or working with large data sets, you can run with Safe Mode by clicking the arrow next to the Run button and choosing Safe Mode.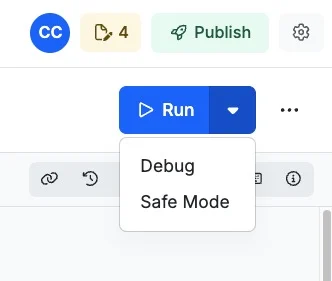
4
Review the response and timing, if desired.
Response
The response block will show you what the workflow has returned, if applicable, once execution has completed.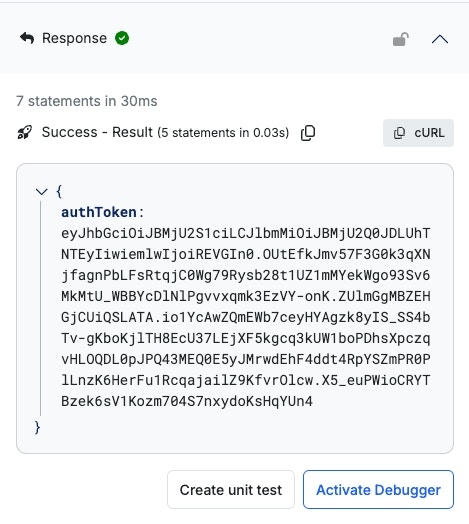
Timing
You can further review more information for each step that executed during this run in the Timing block.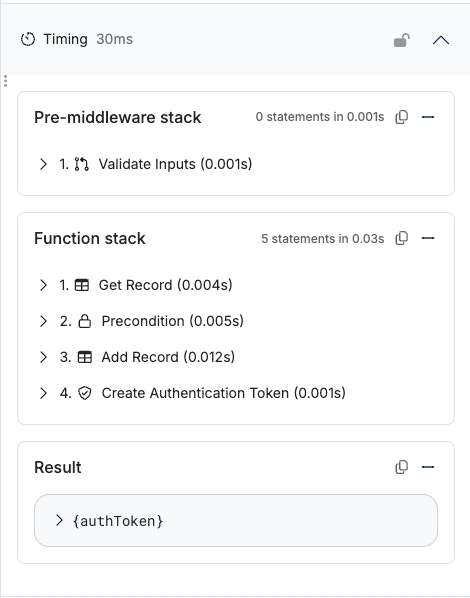
5
What's next?
Run it again by clicking Run Again , reset everything back to the initial state by clicking Reset , or activate the debugger with Activate Debugger .You can also use this opportunity to define sample inputs and responses for your Swagger (OpenAPI Documentation).When testing your function stacks in Xano, you can define sample input and output examples for your Swagger documentation.It is important that you do this to ensure that your documentation is as effective as possible, as well as for helping AI models understand what’s expected when interacting with your APIs.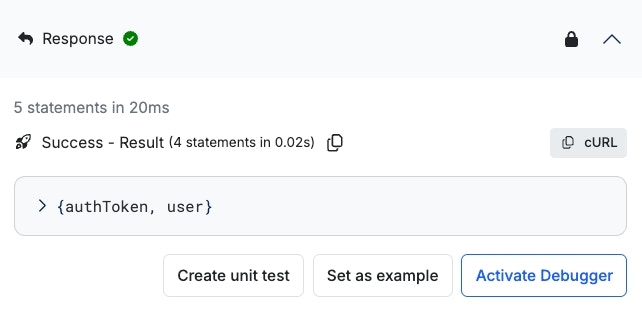
1
In the 'response' section of the Run panel, click Set As Example
2
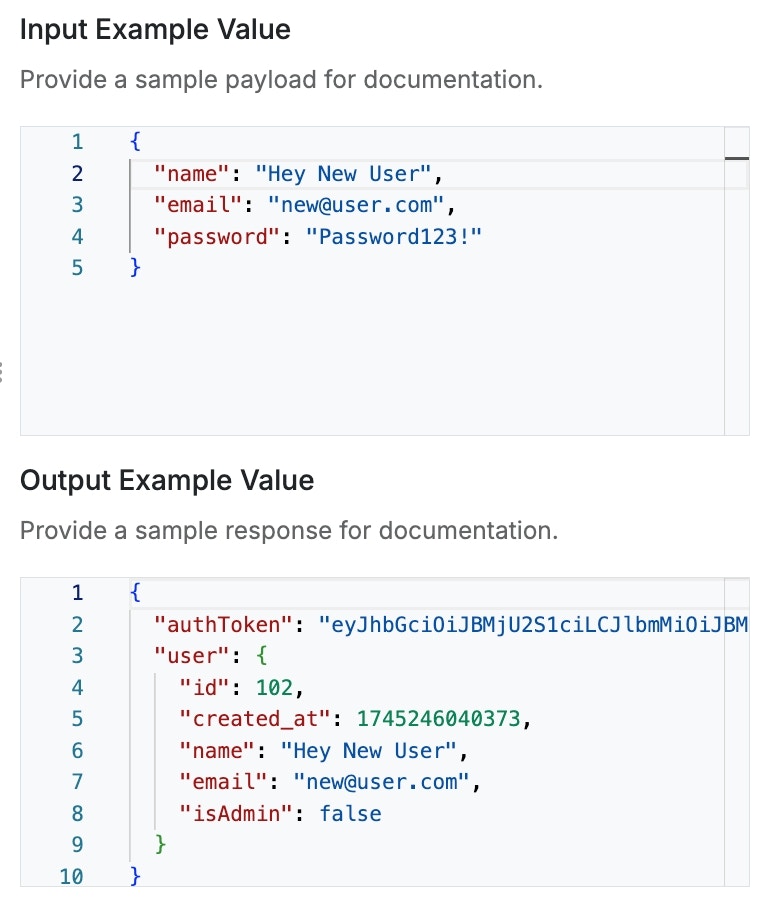
Review the sample input and response, and make any necessary adjustments
3
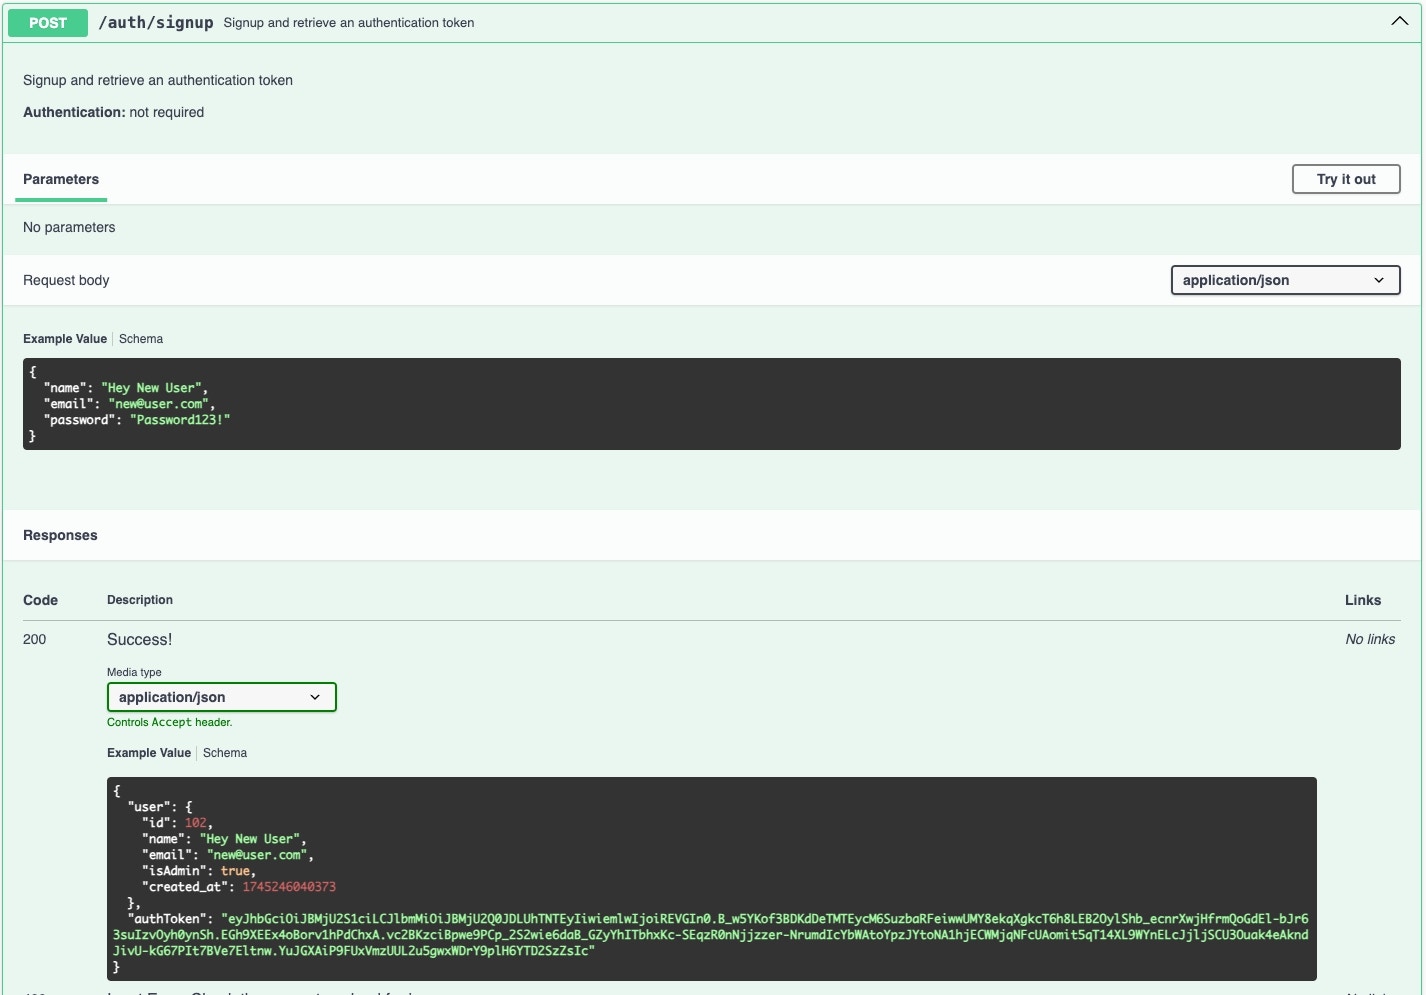
Click Save and you will see these defined in your Swagger documentation.
Using the Debugger
The Debugger is used to review each step of execution, one at a time, to pinpoint the cause of any issues that might arise during that run.Please note that each step is not actually individually being executed; the
full run has completed prior to the debugger being available.
Simple Mode
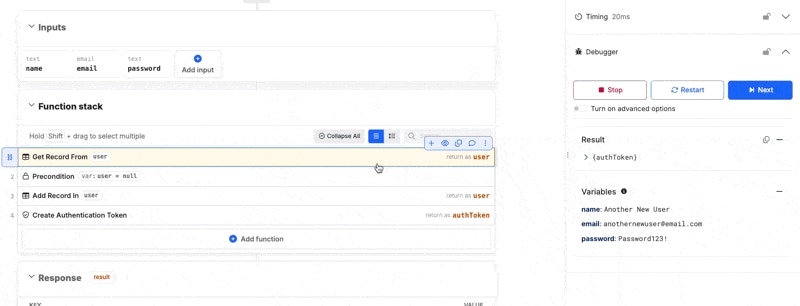
**Stop **- Stop Debugging Restart - Restart the Debugger Next - Move to the next step As you move through each step, the current will be highlighted as shown below.

Advanced Options
Click Turn On Advanced Options to enable the advanced debugging options.- Step Over - When working with nested function stacks (custom functions or middleware), if you don’t need to debug those, just step right over them and continue with the next function in your function stack
- Step Into / Step Out - Step into or out of a nested function (custom function or middleware) and continue the debugging experience seamlessly
- Continue - Continue with execution of your function stack
- Enable Breakpoints - Enable or disable breakpoints as a whole
- Step Forwards / Step Backwards - Toggle forward or reverse execution of your function stack
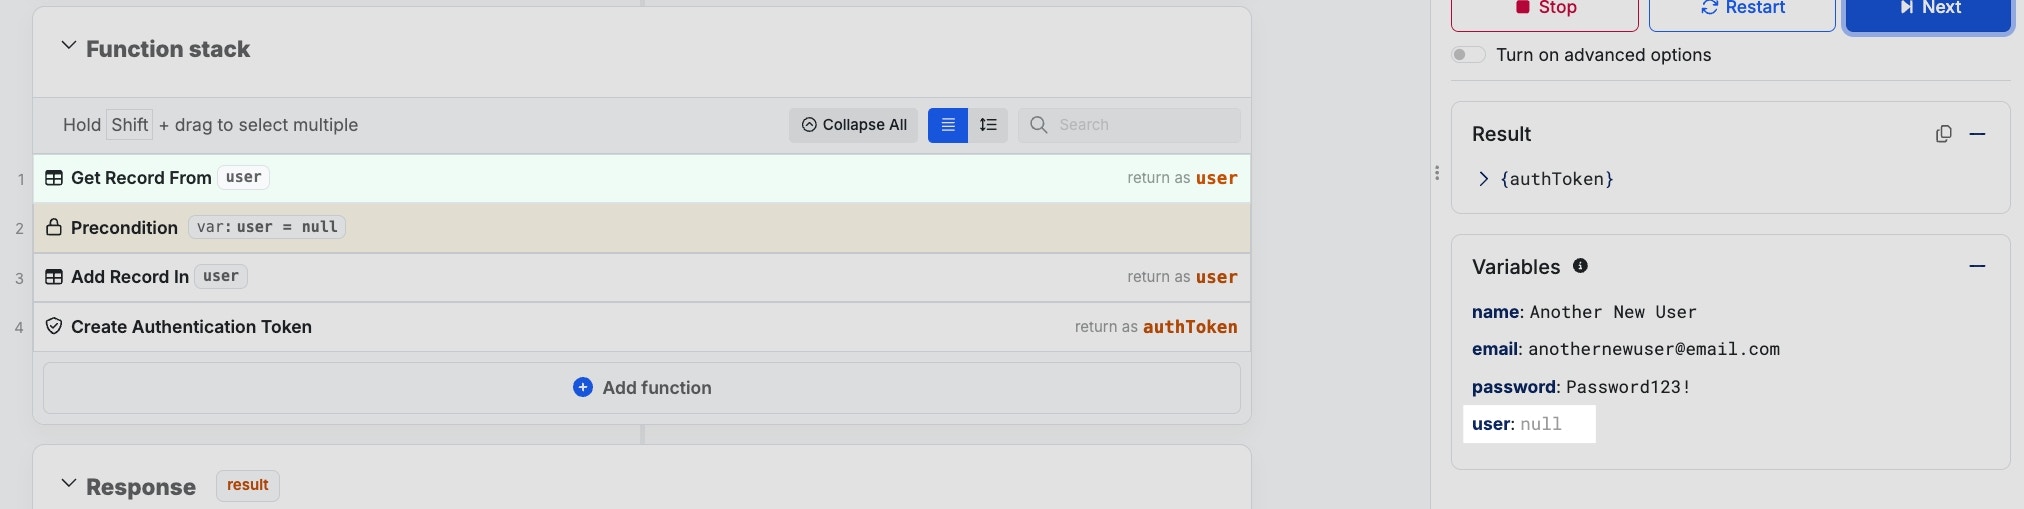
- Result - View the result of your completed execution
- Watches - Use custom Javascript expressions for more complex data monitoring or calculation as your function stack executes
- Variables - View the current contents of your variables as the function stack executes
- Copy 📄 / Add Watch 👁️ - Copies the variable’s current contents, or adds a variable to your Watches list
- Breakpoints - Hover over the icon on the left side of each function to establish a breakpoint. Breakpoints will cause the debugger to pause at that step.
Unknown Errors and Debugger Errors
If you see these messages, they could indicate one of the following:- An unhandled exception in your logic
- This means that you’ve likely ran across a rare error that we don’t yet have specific messaging for. Please let us know about this so we can make an adjustment.
- Server resource issues
Hint - Running in Safe ModeIf you’re running into memory issues when running large function stacks or working with large data sets, you can run with Safe Mode by clicking the arrow next to the Run button and choosing Safe Mode.