Documentation Index
Fetch the complete documentation index at: https://docs.xano.com/llms.txt
Use this file to discover all available pages before exploring further.
API Request History
From the dashboard, easily view the high-level statistics of the API request history from your entire Workspace. You can toggle between your database and top API requests to see which of your API endpoints are being hit the most. To the right, visualize your API request history with a graph displaying the statistics of the past 24 hours. Select ‘View Request Details’ to see a detailed view and history of each API call made in your Workspace. You can expand each individual call to review detailed information including inputs, response and request headers, and the output. You can even drill-down on a per-user basis to see the activity of each user in your application. Furthermore, you can view failed API calls here in order to help debug what went wrong. Finally, you can use these details to understand Webhook payloads to make it easier to build API endpoints that receive Webhooks.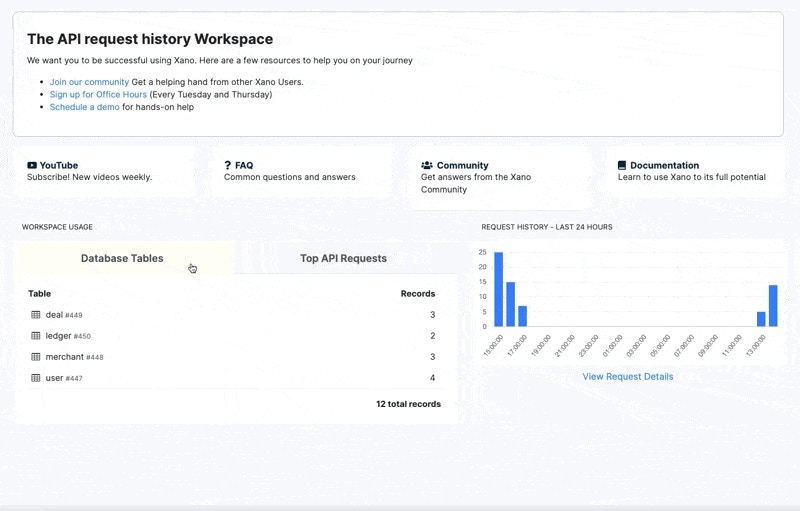
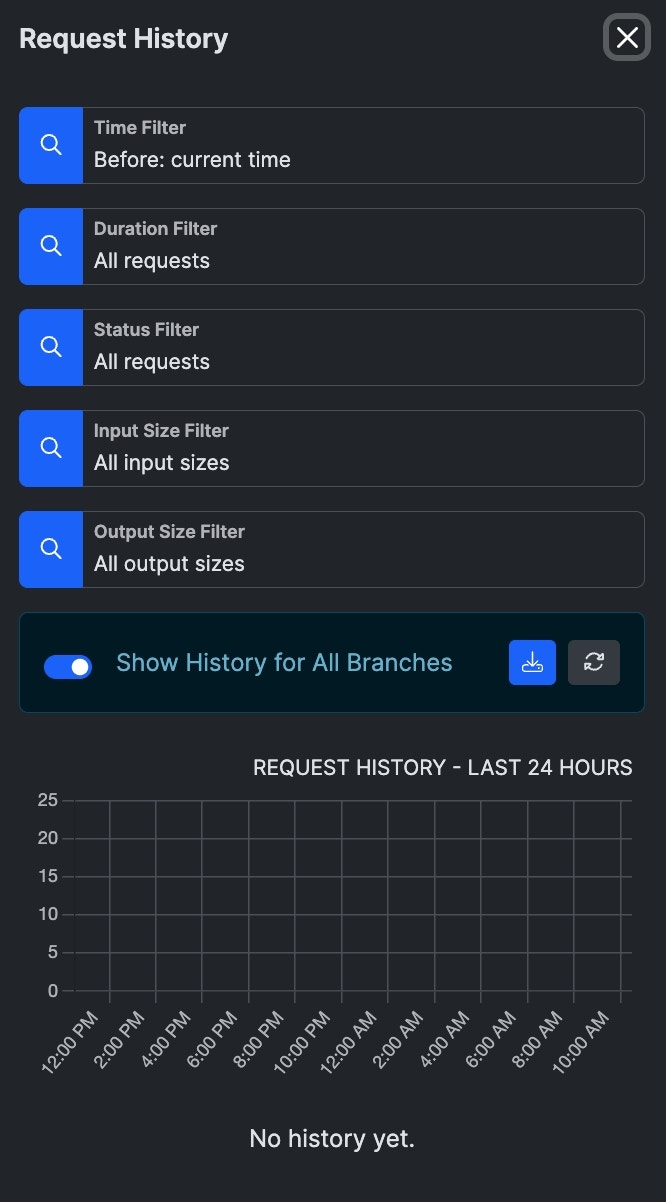
- Time - when the request was received
- Duration - how long the request took
- Status - if there was a standard code returned, filter by that status
- Input / Output Size - how much data was sent to or sent from the request
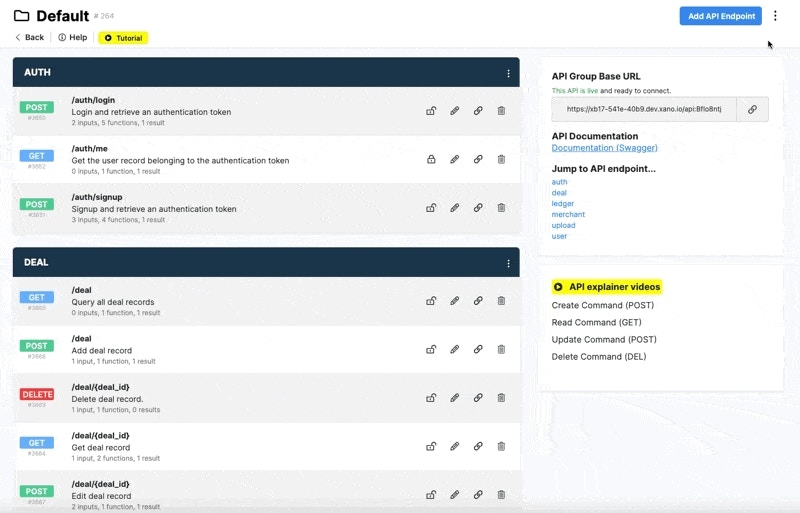
Activate Debugger from Request History
When viewing request history from a specific API endpoint (not the dashboard-level view), you can click Activate Debugger on any request entry. This will re-execute the request and open the debugger, allowing you to step through the entire execution one step at a time. This is especially useful for investigating issues reported in production, as you can quickly replay the exact request that caused a problem and inspect each step of the function stack.This feature is only available when viewing request history from a specific API endpoint. It is not available from the dashboard-level request history view.
Function Request History
Custom Functions are similar to API endpoints in Xano, in the sense that they have the same No-Code API builder UI. However, custom functions can only be called by other internal function stacks in Xano whether that’s an API, other function, or background task. Functions also have a request history for any time a function is part of a live API request. First, open the request history of a function from the top right menu icon.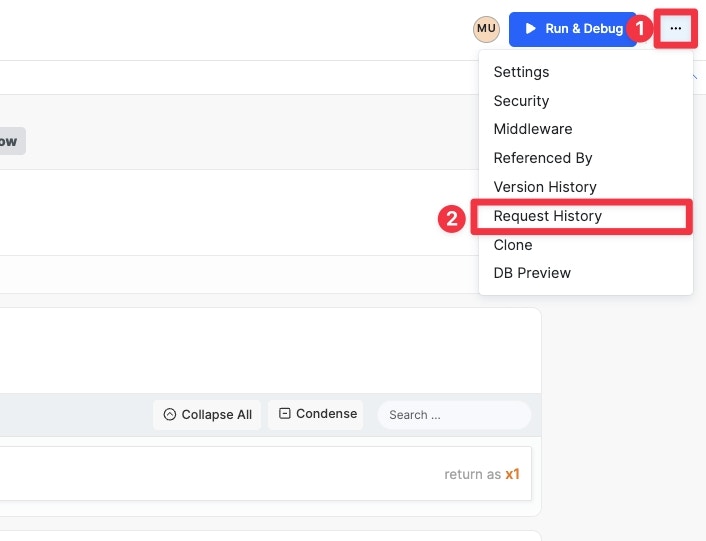
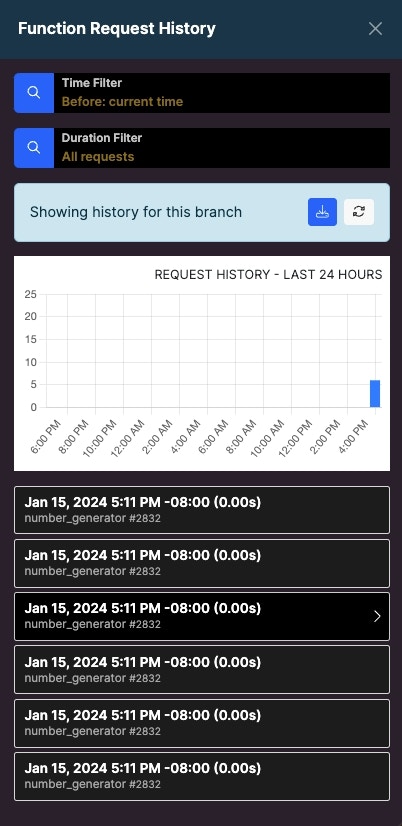
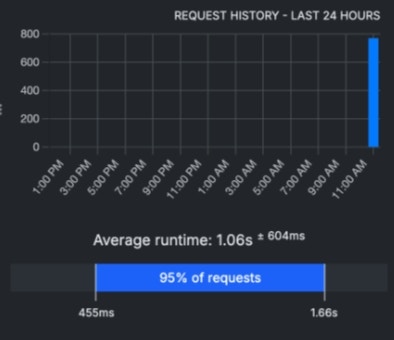
The duration filter can be useful for identifying potential performance issues.
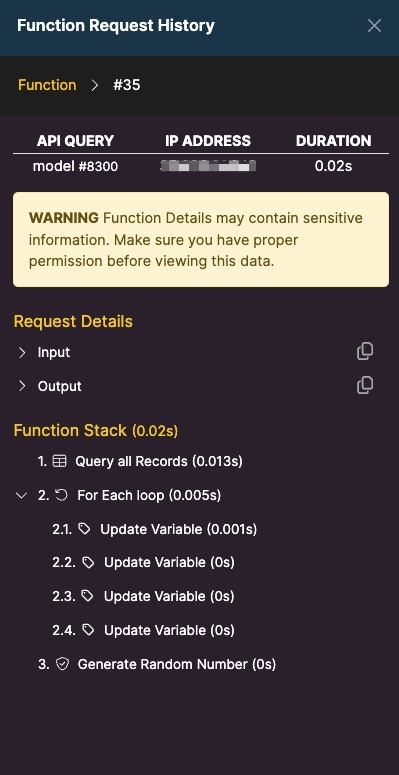
Task History
Task history behaves a little differently than APIs and functions. Tasks maintain a history over 7 days instead of 24 hours. Tasks also do not deliver responses, so no response data will be recorded, but you will still be able to review the statement log, execution status, and the timing details.Middleware History
Middleware history will behave the same as API and function history.Triggers History
Request history for triggers behaves most similar to a task, as there is no output returned with a trigger. You can, however, review the inputs (new, old, action, datasource) and the timing details for each step.Managing Request History
Branch Defaults
These are default settings related to what is logged in your Request HistoryIn your workspace settings, you can manage the request history for your entire workspace in the Branch Defaults panel.
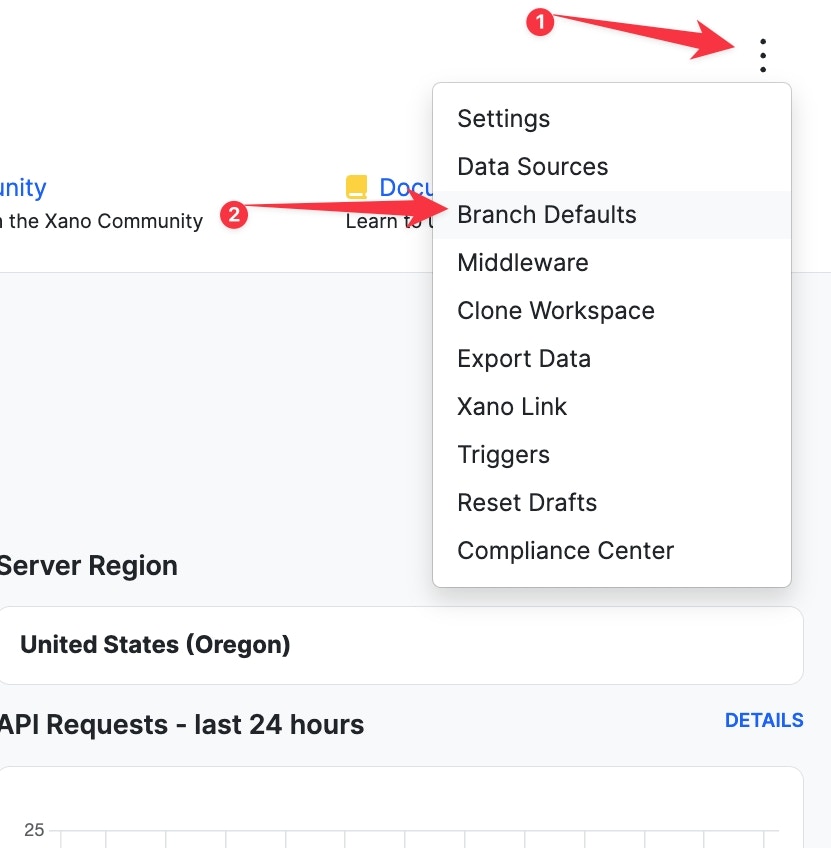
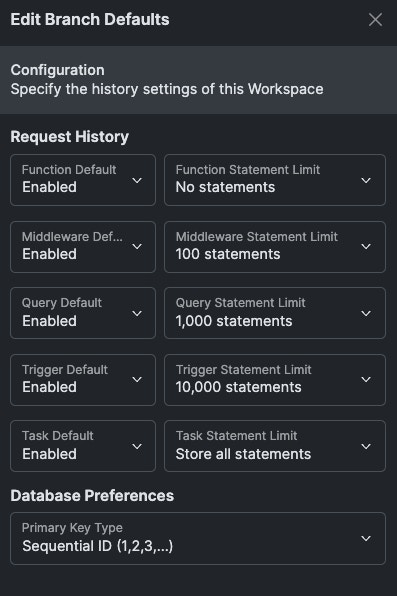
- Enable / Disable - Performs the selected action on the object type
-
Function Statement Limit - The number of statements to record for each object type. You can choose between:
- No statements
- 100 statements
- 1,000 statements
- 10,000 statements
- Store all statements
Inheriting Settings
In each individual API, function, task, middleware, or trigger’s settings, you can also control the request history for that object specifically. By default, these will be set to inherit, which means it will obey the branch defaults. Otherwise, you can adjust this for specific objects as necessary.Clearing Request History
From your Instance settings, you have the option to manually clear your request history at any time.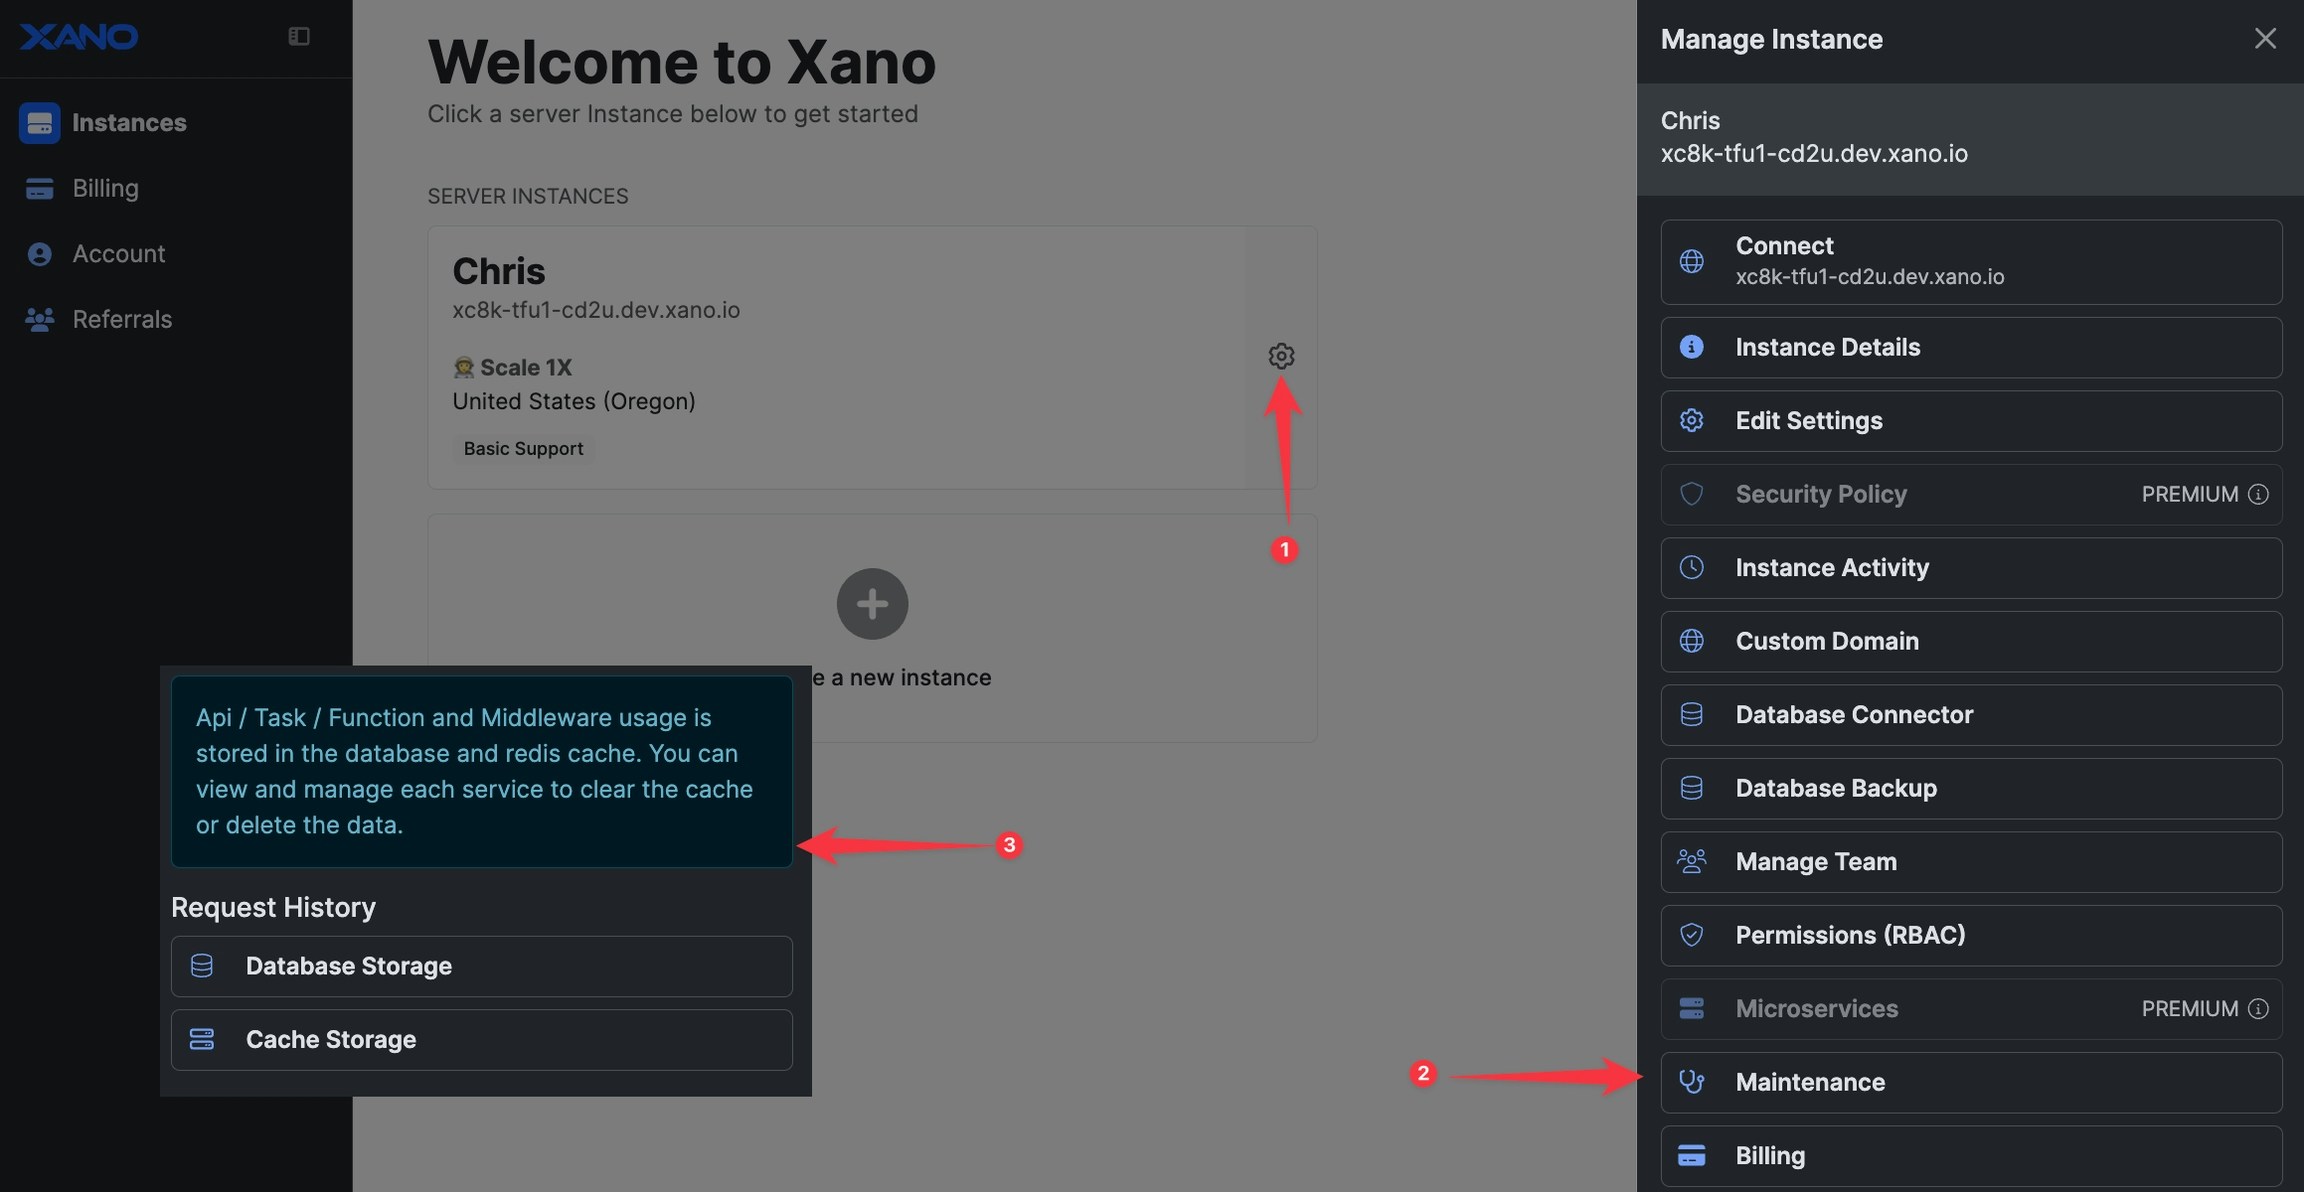
Database Storage for Request History
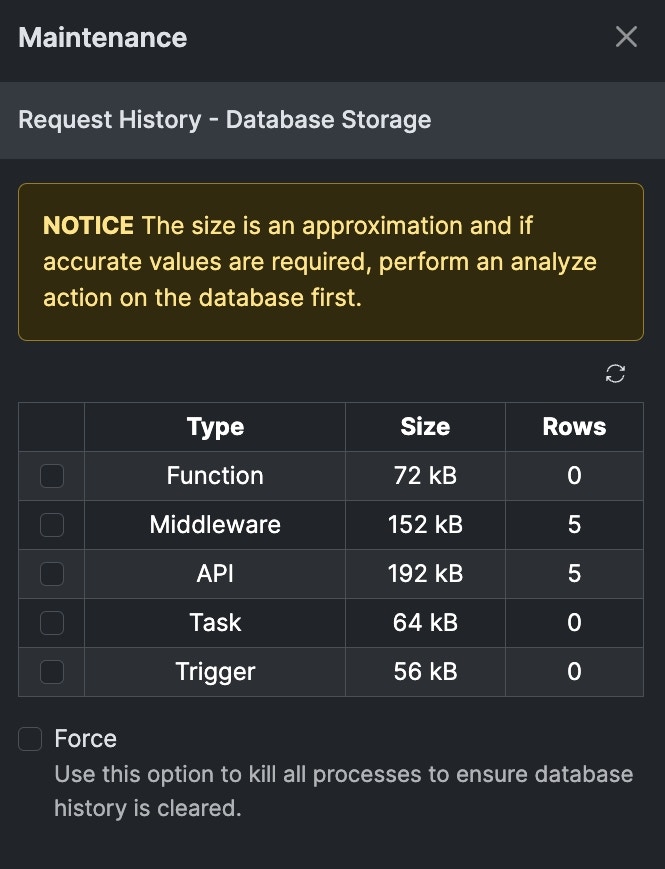
This is the actual database table that contains all of your request history, and counts against your available database storage in your instance. You can click on this option to delete one portion or all of your request history at any time.